Friday, December 30, 2005

Rockefeller Chapel and the Moon, 2001 July 3rd

.
The Gibbous Moon rising over Rockefeller Chapel, taken over 4 years ago from Ryerson.
I took this image with an Olympus E-10. It was a humid but nice evening. What can't be seen are the hordes of gnats flying around nor the thunderstorm to the west. I also took an image of the Sears Tower with a tall thunderstorm behind it, with the idea to use the known distance and height of the tower to determine something about the cloud behind it (although you need one more bit of information about the cloud to figure it out).

Saturday, December 24, 2005

Posner's failed analysis of domestic spying

Posner writes a defense against the illegal searches of domestic communications:
Posner wrote:
The collection, mainly through electronic means, of vast amounts of personal data is said to invade privacy. But machine collection and processing of data cannot, as such, invade privacy. Because of their volume, the data are first sifted by computers, which search for names, addresses, phone numbers, etc., that may have intelligence value. This initial sifting, far from invading privacy (a computer is not a sentient being), keeps most private data from being read by any intelligence officer.


You can't open up my mail (or e-mail) and look for names, addresses, and phone numbers without violating my privacy. The courts have held that e-mail headers are like pen information on phone calls, but the contents of the message are private. Get that? It doesn't matter what or who in the government opens my private communication, they've opened it and it's a clear violation of the Fourth Amendment.

You've got to have a warrant, mister, with a good reason, signed by a judge (hopefully not Posner), describing exactly what you are looking for and why you think you have sufficient cause. You can't open up everyone's communications fishing for crimes.

P.S. Richard Posner later writes during a chat:
I don't think most people would mind the government's scrutinizing their conversations for information of potential intelligence value if they trusted the government not to misuse the information.

Uhh... yeah, we mind. This fellow probably shouldn't be a judge based on his poor reading of the Constitution. It's not what "most people" would mind, it's whether these things violate the Constitution. And they do.

ILL update

That loser student lied about the ILL/DHS visit! The liar!

Wednesday, December 21, 2005

Computer abuse in copy-protection rootkit software

Ed Felten in Freedom to Tinker finally brings up what's been missing in the debate about aggressive copy-protection schemes, namely, that they are violating computer abuse laws left and right, and the companies should be prosecuted to the full extent of the law, and penalized just as hard as the "computer hackers" are--putting the CEO of Sony, SunnComm/Mediamax, or First4Internet in jail for four years would show 1. Computer abuse, either by individual or corporation, is not tolerated and 2. Corporations, if they argue they deserve rights just like people, should get the punishments delivered to them as well. Computer abuse applies not only to the crazy copy-protection rootkits but to most spyware as well.

Monday, December 19, 2005

The Sun as a 2.4 GHz source, redux.

I previously wrote an entry about how you can see the Sun interfering with the weather radar at sunrise and sunset, seen here. The weather radar uses radio waves at about 3 GHz. Seen linked at Hackaday is a 2.4GHZ field strength meter using a microwave diode, a few capacitors and a simple "quad" antenna and measured using a digital multimeter. They report that the Sun generates a reading on their device!

Saturday, December 17, 2005

Checking out "Little Red Book" brings visit by government agents

Update Wanker student lied... It's a hoax... South Coast story. To say again.. liar liar liar. I hate liars.

This is unacceptable.

Agents' visit chills UMass Dartmouth senior

How the DHS is searching Inter-Library Loan requests is unknown, probably through one of the big ILL mediators like OCLC's Illiad.

Academic freedom to read and discuss whatever, to expose yourself to all ideas, including foreign ones, is paramount to a democracy. The DHS is inviting fascism by doing this.

Since I am an employee of an academic library, my employment is dependent on the ability of students and faculty trusting that their choices in what they choose to read is relatively private. We offer the ability to patrons to find out who has a particular book out, but only if they agree to the same reciprocal privileges. It's a tradeoff--I could find out who has checked out a copy of Mao Tse-Tung, but someone else looking for a copy of "Uranium" would know I had it borrowed. But with a secret warrant, the government can know what you have read without any notice to anyone. Unacceptable.

I would encourage anyone concerned about this to obviously complain to your elected officials, but also ask about your local library's policies regarding data retention, and encourage them to clean out the data as appropriate. Is your library's policy written and available to you?

Here is the ALA's Library Bill of Rights.

Thursday, December 08, 2005

Amboy Crater Beetle


I am a small fuzzy beetle living in the sands among the lava flows of Amboy Crater!

Thursday, December 01, 2005

live radiation reports from my office

http://www.lib.uchicago.edu/~dean/float.htm

It's completely temporary, and could go down at any time, but the average radiation rate for the last minute in my basement office is available at the link. The long term average for the geiger counter is about 7.6 microrads / hour. If the rate goes up to 30 or so, it's likely I put a small dixie cup of western Michigan beach sand on it (the sand is enriched in monzanite which has a small amount of thorium in it).

UPDATE: Back up and running: http://dwarmstr.blogspot.com/2011/03/geiger-counter-back-up.html

Monday, November 07, 2005

Nova: Volcano under the City

An episode of Nova I watched because it was 1. in HD and 2. Geoscience related. As unfortunately usual, another earth science Nova with excessive overdramatization. Like an earlier episode about the scablands of eastern Washington, the dramatics overwhelm any science presented. The research wasn't really explained until near the end, when they finally mentioned WHY volcanologists were going after fresh lava. Let's balance the danger/people/adventure aspect with more science. That's what Nova was for, wasn't it? Scientific American Frontiers does a much better job explaining science and what scientists do. Nova always had a bit of the National Geographic travelogue in it, but it's gone way too much to that now.

"Constant observation is necessary, for when it erupts, a new name could be added to the most deadly disasters in human history....Nyiragongo!"

Wednesday, November 02, 2005

United colors of plutonium

Plutonium, like a lot of the other transition metals, has a number of oxidation states and all of them are colorful. The valence ranges from +3 to +7, with +4 being the most common state.


This image was provided through Los Alamos or Lawrence Livermore National Laboratories; Wikipedia claims it's from LLNL but LANL uses it on a page at their site. The four colors on the right are the +4 valence forming different complexes with different anions.


I edited the image and concatenated the colors together for a palette. It looks like some sort of bad hotel color scheme.


P.S. There is some discussion of the first separation of plutonium here: http://chemcases.com/2003version/nuclear/nc-04.htm

Monday, October 31, 2005

Two new satellites of Pluto/Charon!

http://www.boulder.swri.edu/plutonews/.

Once again, Minor Planet Mailing List has the scoop. Two ~100km bodies orbiting in the same plane as Charon and at 23rd magnitude found via the Hubble Space Telescope. Good thing we haven't dumped it in the ocean yet.

IAU official announcement


This image from Alan Stern (SwRI), Hal Weaver (JHU APL), Max Mutchler (STScI), Andrew Steffl (SwRI), Bill Merline (SwRI), Marc Buie (Lowell Observatory), John Spencer (SwRI), Eliot Young (SwRI), and Leslie Young (SwRI).

Wednesday, October 26, 2005

Faulty logic

Is lithium safe for the environment?

Yes. Much of the concern with the environment centers on heavy metals.
Lithium is the lightest metal known.


Content-light, I know, I'm working on something.

Monday, October 24, 2005

Poof

I see that it appears my blog has been wiped from the face of blogspot. Will it come back?

Monday, October 17, 2005

LA Times on 2003 UB313

"Ortiz's boss, astronomer Jose Carlos del Toro Iniesta, concedes that those rights will most likely be awarded to Brown.

"I think there is no longer a debate," he said in an e-mail message to The Times. "Dr. Ortiz acknowledges that Brown's team spotted the object in their archives prior to him.""
http://www.latimes.com/news/local/la-me-planet16oct16,1,3949603,full.story

Saturday, October 15, 2005

Linne statue in the near infrared


I took this photo over the summer. The Linne statue is on the Midway on the University of Chicago campus and to the eye is covered in a light greenish patina but goes quite dark in the near infrared.

P.S. One thing I forgot to mention is that I changed the hue so that the vegetation is green and the sky is blue. Another one like that is here. Also I corrected the incorrect link to the big Linne image.

Thursday, October 13, 2005

ABC Primetime: Radioactive Road Trip

What a piece of alarmist drivel. ABC Primetime "exposed" the security of university teaching and research reactors.

"Oh my god! Tours of reactors without background checks!"

"40kg of highly-enriched weapons-grade uranium in the reactor--without security!"
It might be 40kg, but it's sitting in rods with so highly radioactive nuclides it would kill them in a second. No one could handle it at all, and could never actually process it to get the uranium out.

"Big backpacks on campus--they could be full of books--I mean bombs!"

"Building plans on-line! of buildings on campus!" Wouldn't want students to find where their classes were or anything.

"Two nuclear bombs worth of uranium--to make topazes more blue." Yes, again, completely untouchable uranium.

Yes, journalism students looking like, I don't know, students, got tours of university facilities. God forbid!

Universities are places far removed from the insanity that is the paranoia filled United States of today. They allow for actual learning free from irrational thought.

MIT got boned because ABC drove a moving truck near the containment vessel and then followed the clip with a shot of the Oklahama City Bombing. It's a frickin' containment vessel made of inches thick steel and feet of concrete. It can't be broken.

Did ABC show ANY ANY nuclear engineers on camera? Just the NRC head, who knew how to deal with media--apologize and promise to tighten things up. Ask an engineer about a reactor and learn about the safety features. You can't get bomb material from a reactor without industrial processes. Ask the US Government on the square miles of buildings they used to extract plutonium at Hanford.

Tuesday, October 11, 2005

Sunday, October 09, 2005

NYTimes Article: How the City Sank excerpt

How the City Sank

"The pump operator's story reflects a spirit of civic responsibility that rallied in humble quarters like these when Hurricane Katrina roared through the Gulf Coast, soon to be followed by Hurricane Rita. At the same time, it illustrates the degree to which the once-solid foundations of that system have become an illusion. For decades now, we have been witnessing the slow, ruthless dismantling of the nation's urban infrastructure. The crumbling levees in New Orleans are only the most conspicuous evidence of this decline: it's evident everywhere, from Amtrak's aging track system to New York's decaying public school buildings.

Rather than confront the causes of that deterioration, we are encouraged to overlook it, lost in a cloud of tourist distractions like casinos, convention centers, spruced-up historic quarters and festival marketplaces.

The inadequacy of that vision has now become glaringly obvious. And the problem cannot simply be repaired with reinforcement bars or dabs of cement. Instead, our decision makers will have to face up to what our cities have become, and why.

The great American cities of the early 20th century were built on the vision of its engineers, not just architects. That spirit can be found in the aqueduct that William Mulholland built in the 1910's, transforming the parched Los Angeles desert into a sprawling urban oasis. And it paved the way for the soaring skylines of Chicago and Manhattan architects."

Sunday, October 02, 2005

2003 UB313 has a satellite

Oh boy! Brown using Keck and the adaptive optics there managed to detect an object moving in the same direction as 2003 UB313 and about a half an arcsecond away. When further observations are made and a period found for the satellite, the mass of the parent body will be known! MPML for a forwarded announcement or all the press stories.

The Keck 10m scope can easily beat the resolution of the Hubble Space Telescope when it is using the adaptive optics system, but it only beats Hubble over a very small patch of the sky at a time. It's great for looking at singular near point-source objects.

How does knowing a moon's orbit give you the mass of the parent? Here is what you know: You know the angular distance between the moon and the parent, which gives you the actual distance away from the planet, since you also know the distance to the planet from the Earth. Using Newton's formula of F=G*M1*M2/R^2, and that the apparent centripetal force for the moon is F=M2v^2/R, the two forces are equal, so you get that the velocity is equal to the square root of (G*M1/R).
The period is equal to 2pi*R/v.

So, the period is equal to 2pi*R/(square root of (G * M1/R).
Or you can say the Mass of the planet is equal to 4pi * R^3/G * T2. I think. Okay, I went back and checked some sites, and my derivation looks correct. This site has a good look at it.

Wednesday, September 28, 2005

Dumbbell Nebula Messier 27 from last night


I took a quick set of shots of Messier 27, a planetary nebula, last night from Ryerson, after fixing a piece of equipment on the telescope. This is 128 images of 15 seconds added together to make a 32 minute equivalent exposure.

Wednesday, September 21, 2005

Cajon Pass

Have you ever driven from Las Vegas to Los Angeles? Two thirds of the way there, you are driving along I-15 in the high, dry Mojave Desert at 3,000 to 4,000 ft, and suddenly you begin a steep curving descent, reaching very high speeds, hoping to retain control of your car. The topography is tortured with impossibly steep mountains and hills running across your path, but... you look far below and see a large wash cutting a path through the mess, and that is what the freeway follows. You see that the freight trains too run through this steep canyon. If you knew a little more, you'd also know that all the infrastructure for gas and oil to Las Vegas runs through here too. A few minutes of this wild driving and then you are dumped out into a low plain; it's cooler, more humid; the coastal air is tinged with both Pacific moisture and the exhaust of 15 million cars.

The drop, the canyon you pass through, is Cajon Pass. It is a critical transportation, infrastructure, and drainage corridor. It is also entirely a creation of the San Andreas Fault.

On your left side as you head towards L.A. are the San Bernardino Mountains. On your right, and more impressive in appearance, are the San Gabriels. They, and some other ranges to the west, constitute the Transverse Ranges, a east-west set of ranges. They are really one mountain range, formed from the compression along a kink in the San Andreas slip-strike fault. The motion of the Pacific plate, normally slipping smoothly, rides hard against the North American Plate at this location, compressing the land up into an unstable, steep, untenable range.

Why there is a usuable (although steep) pass right in the middle of the mountains can't be ascribed to luck--the San Andreas Fault runs NW-SE right through the pass. You can see a diagram of this from here: http://www.laep.org/target/fragile_habitats/images/mtns_calif.gif (The link was down today but it's been up before).
Also, I've annotated a TERRA image of Southern California:


The full image showing the whole region is here:


This is a nice block diagram showing the region from the USGS.

Imagine sliding the left side of the satellite image down and to the right, and now the San Gabriels and San Bernandinos line up.

Not only does the fault create the range, it also slices the range up.

University of Chicago and Hyde Park types will be amused by the roads in the small settlement near the base of the canyon. Google Hybrid link.

Another point of interest is the strongest plume of sediment you can see in the ocean. The Cajon Pass drains through a convoluted path of washes, creeks, and dams to the sea right there. Is some of that silt from the rapidly eroding rocks of the Pass? Absolutely.

I originally started writing this entry in August, trying to start out with a broad comment about how geology completely controls topography. I am amazed at how every geographic and topographic structure can be explained geologically. That approach to the entry didn't work, so instead I wrote about a specific instance. And what's amazing is I am finding these explanations everywhere.

Thursday, September 15, 2005

Ortiz response

This was posted on the Minor Planet Mailing List by Ladislav Nemec.

Michael Brown wrote up his page about the issue here.

Reiner Stoss forwarded Brian Marsden's CCNet post about the issue to the MPML as well; it is available here for the moment.


Hello MPML,

Jose Luis Ortiz of Sierra Nevada Observatory asked me
to forward his letter.

-----------------------------------------------------

Hello MPML, I provide you this information which will
go to my webpage in the next days. The detailed timeline
of our find was given to Daniel Green, director of CBAT long
before any controversy. Anyone can ask him and check against
any other timings of events provided by M. Brown. I suppose
that this has been done by the pertinent authorities and
that is why no official request on anything has been sent to
us by the International Astronomical Union (IAU).

Here I will repeat the timeline of events and even expand
some details:

The analysis of most of our 2003 survey images had been
postponed several times because they had a different optical
configuration to the current one and many images had problems,
so only this year did we begin processing them.

On Monday July 25th the object is found in some of our
March 2003 triplet images. We do all possible checks to discard
image artefacts being the cause and to make sure it is not a
false positive. We had had false positives in the past so we
were very careful. We realized that the object was very bright
and could be the same one mentioned in a DPS abstract web page.
A regular google internet search on K40506A leads to a public
internet web page with what appears to be coordinates of many
things. This is no hacking or access to private information nor
spying of any sort. Some of the coordinates shown in those pages
are not very far from ours despite the several years difference
so the object could be the same one but we cannot really tell as
we are not dynamicists and we decided to submit the astrometry
to the Minor Planet Center (MPC) because the MPC is to make such
things.

On Wednesday 27th a report with our 3-day 2003 astrometry is
sent to the MPC with the subject "possible new object" as we
were not sure if it could be new or not. MPC reports have a very
short and specific format and are not regular scientific publications.
Astrometry of known or unknown objects is regularly submitted by
many of us to MPC and as I said they are not peer-reviewed
publications and have no references or bibliography sections,
but even if we had that option there was no possible reference to
give as K40506A was nothing standard and it was not even sure that
it was K40506A.

Apparently this report went unnoticed to the MPC and since we did
not get a response, the next day we seek help of OAM people for
precovery (that is, to try to find the object in publicly available
image archives on the internet) as we had no experience on this.
This requires orbital computations for which we do not have expertise.
R. Stoss was particularly helpful as a reputed person in precoveries.
The description of the process is very technical but I reproduce
it here anyway, quoting parts of his own words to the minor planet
mailing list.

------
The initial orbit based on the three positions from 2003 was a
crap, even retrograde if I remember well, but it was good enough
to find it on NEAT data from few days later. This way the orbit
was improved iteratively, the prediction improved, new frames
found etc. until the NEAT archive was plundered. The next step
then is to go to DSS, until back to POSS I. From all the 1-opp
TNO precoveries I had done so far, this one was a no-brainer.
The object was very bright and the "stepstones" were perfect,
i.e. the frames and plates were perfectly "timed". Thus DSS2
and 1 were plundered and some POSS I non-DSS plates as well and
both NEAT and DSS data submitted.

Additionally, as it was getting dark in Spain and weather was
clear in Mallorca, I opened over internet the 30-cm scope and
started to prepare it for the night, looking We had to start
before the end of nautical twilight because the object would set
behind the shelter soon. We did 30 images of 30s each and stacked
with Astrometrica in sets of 10 images to get three measurements.
Motion could not be seen visually but the numbers showed it moving
and in the right direction. So I decided we should report these
three data points instead of stacking all 30 images to get one
data point. One data point would have been better (better SNR etc.)
but I know the MPC folks and their pretentions
------

As a result of all of this the provisional designation of the
object was assigned to our 2003 images, but Brown's group received
credit through several means. It is evident that they spotted it
first, but did not report it to the MPC so the provisional
designation came to our images.

We have been studying physical properties of large Trans Neptunian
Objects for several years and have published more than 10 scientific
peer-reviewed papers on them, so we are driven by purely scientific
goals here. We conduct also our own survey since late 2002 in order
to find a few very large TNOs and report them to the astronomical
community as soon as we find and confirm them because we believe that
international scientists working together, collaborating and sharing
resources can boost science progress and do the best possible job.
In other words, our survey is not only to feed our work, but also to
provide the scientific community with objects that can soon be
studied by the international community with all its man and
technology power.

Jose L. Ortiz

Friday, September 09, 2005

potassium part 2

Sure enough, as I suspected in my previous post, taking the potassium chloride out of the container brought the count rate up 50% to 120 microrads/hr. I celebrated by tasting it, confident in my body's metabolic control over potassium. It was salty.

Thursday, September 08, 2005

2003UB313

Brown, Trujillo and Rabinowitz have submitted a paper to ApJ Letters for it:
http://www.gps.caltech.edu/%7Embrown/papers/ps/xena.pdf

2003 EL61: bulgy or salt and pepper?

The TNO object first reported by the Ortiz et al now has a light curve that either has it spinning every fast and non-spherical or covered in spots a la Pluto.

New Scientist has the press release.

Wednesday, September 07, 2005

Division for Planetary Sciences meeting

The DPS of the American Astronomical Society is meeting with the Royal Astronomical Society (alas, not that RAS) in Cambridge this week. This is the meeting where Michael Brown, Trujillo, et al at Keck are announcing their big TNOs. Will we find out the proposed name for 2003 UB313 and 2003 EL61 and it's satellite?

Tuesday, September 06, 2005

Radioactive potassium

A store-bought container of potassium chloride, aka Salt Substitute, contains enough of the naturally occurring potassium-40 isotope ( 0.0117% abundance per the CRC, page 4-24) to produce 5.5x the amount of background radiation when placed on a geiger counter, with the container intact. The rate would have been higher if I had taken the salt out of the container, as the metal base shields some percentage of the 1.31MeV(max) beta electrons.


Paul Frame at Oak Ridge has a great site about radioactive consumer products at http://www.orau.org/ptp/collection/consumer%20products/consumer.htm
and see the potassium info page at http://www.orau.org/ptp/collection/consumer%20products/potassiumgeneralinfo.htm

Monday, August 29, 2005

Thursday, August 25, 2005

Salton Sea Algal Bloom animation

True Story: I developed this animation _before_ discovering Jacques Descloitres of the MODIS Rapid Response Team, NASA/GSFC's work. It does say there is an animation available but I haven't seen it from anywhere. What I had done was I searched the TERRA gallery with "Salton" and grabbed a long series of images from there to make an animation, without the knowledge that the set had probably been created for that purpose. Since I can't find the animation, here is my attempt. I cropped the originals down to 720x610 and used Imageready to animate it.

Salton Sea Algal Bloom -- Warning -- 18MB

Watch for the irrigated fields in the Imperial Valley blink on and off over time in the animation.

Monday, August 15, 2005

Yum... algae!

Just perusing TERRA images again, and I noticed the Salton Sea has a nice algal bloom going right now. Too many phosphates from farm runoff and lots of sunlight & warm temperatures = yuck!

Saturday, July 30, 2005

Bad time to be away

Brown's team, afraid of being upstaged by someone else, dropped the bomb in announcing 2003 UB313 -- and finally found the big one. Bigger than Pluto. It had to happen.

Thursday, July 28, 2005

Huge new Kuiper Belt Object / Transneptunian Object?

2003 EL61. A Spanish survey claims to have found a mid 17th magnitude object with a proper motion consistent with a TNO at 51 AU distance, and have images of it from 2002 and 2003.

Their web site

According to our best orbit fit and using regular assumptions on phase angle
correction, the H value es around 0.3. Unfortunately we do not know the
geometric albedo but if below 0.25 (which is the case of all TNOs for which an
albedo has been measured except Pluto), the object would be larger than Pluto.
However, it may well happen that this object is abnormally bright (with a very
high albedo), like Pluto. So, depending on the albedo, this object might be sort
of a Pluto's brother or Pluto's father...

This object is beyond Pluto and almost reachable by most amateurs, which is the
reason why we write here!. It is observable right after sunset for a while at a
reasonable elevation. Maybe some decent science can still come out of your
observations.


Time will tell if it is a legitimate huge find. The size/population numbers have always indicated that there should probably be at least one more Pluto-size object out there, and I always believed someone would find it. Early KBO papers after the discovery by Jewitt and Luu of 1992 QB1 discussed the size distribution with Pluto at the top and kept the option open of other big ones.

Saturday, July 23, 2005

Completed projects and stuff to do.

I realized after seeing this that I have failed to remember to write up completed projects of the past. So some brainstorming about what's been done is appropriate.

Solar Spectroscope design
Digital setting circles on Ryerson telescope
Long-term office radiation -- just finished a long series at work 9.3microRads/hr.


stuff to do
humidity project
lightning detector
VLF radio on computer
coffee can furnace (finally a place to use those huge aluminum backplanes on hard drives)
light pollution sensor
fabric dyes (coffee, mulberry)

Tuesday, July 19, 2005

Linking to other blogs

Do people generate hits by linking to other people's blogs? I.e., the almost required links on the right of every blog?

Disassembling printers can be useful

I actually used knowledge gained from taking apart those inkjet printers to actually fix a big expensive inkjet at work today! Seems someone created a paper jam that jammed up into the path of the speeding ink carriage, knocking it off the drive belt.

Friday, July 08, 2005

Inkjet printer technology

I disassembled a broken Epson C80 inkjet printer the other day. They nearly always clog if you don't use them constantly, if you use them constantly but have low humidity, or if you look at them the wrong way. It was a useful exercise, and I learned a few things about the state of printer engineering and how things change over time.

The engineers have decided that the principle of "imprecise positioning with a cheap motor, but with feedback", is a better/faster/cheaper approach than "precise positioning, assume the motor goes where commanded". Instead of stepper motors, with their high torque and their ability to hold them at a defined angle, they used standard DC motors, and read what they're doing via optical encoders, both rotary and linear, on the axles they move (aka servos). In the telescope world, most people prefer to use steppers for positioning. http://www.cs.uiowa.edu/~jones/step/ is a full overview of steppers. I got into learning about motors from the king of converting telescopes into computer-controlled monsters: Mel Bartels

You can tell you have a stepper in your hand if the motor has four or more wires going into it. When you turn the shaft of them, they should feel like they move into defined positions as you rotate it.

I've taken apart a number of inkjet printers, starting with old HP Deskjets from 1990. They used encoders and standard motors too, but the printer was designed to last. Canon Bubblejets from the mid-90's used steppers; and I had always assumed all printers would from now on. The HP Deskjets also used a Z80 CPU; I'd always loved that an ancient processor was still being used in embedded stuff. Keith tells me it's a great processor.

In addition to the DC motors I get some encoders, a beautiful aluminum heatsink, and a 1/3Farad backup capacitor. I would have had a huge absorptive sponge too, but it was full of ink.

Thursday, July 07, 2005

Steven is (or was) here

The TERRA satellite rocks. Steven is in the Yucatan in Mexico. I grabbed an image from TERRA taken on June 30th. The linked file is a huge crop from a even bigger image.

Thursday, June 30, 2005

The sun as a microwave source


The Sun is a convenient source of radio waves. You can see this yourself by watching weather radar around sunrise or sunset. Radar works by emitting a very short pulse of microwave radiation. Then it listens for the weak returns for a short time (since a radar beam is line of sight, there is no point is listening for returns past 200 miles or so because of the curvature of the earth, or roughly 1 millisecond). The time it takes to hear the return gives you the "range" or distance to the object that reflected the beam. When the sun is low on the horizon, the radar receiver picks up the radiation as if it were a continuous return, and it's visible on all of the weather radars.

The image is of the radar from St. Louis last night at 8:28 PM CDT. You can see how the weather radar interprets a continuous return as if there were stronger reflectors further out, and how far north the sun is at this time of year near the summer solstice.

Sunday, June 26, 2005

Colin is here


Colin is spending the summer and next year in Santiago, Chile. I pulled up a recent TERRA image of Chile & surrounding areas:

http://rapidfire.sci.gsfc.nasa.gov/realtime/single.php?2005175/crefl1_143.A2005175145500-2005175150000.2km.jpg

If you have a computer with a lot of memory and a great Internet connection, try this one: http://rapidfire.sci.gsfc.nasa.gov/realtime/single.php?2005175/crefl1_143.A2005175145500-2005175150000.250m.jpg

These images were taken on 06/24/05 at 14:55 UTC, about three days ago.

As usual, wikipedia has a link to great canonical satellite image of the city: http://eol.jsc.nasa.gov/sseop/images/city/lowres/ISS004/ISS004-E-6990.JPG

A really high-res image of part of the city is here: http://www.landinfo.com/GalSatIkonosSantiago.htm

Planetary conjunction

Mercury, Saturn, and Venus bunch up low in the evening sky.
http://skyandtelescope.com/observing/article_1534_1.asp

Saturday, June 25, 2005

Don't always assume

For some reason I trust newspapers' web sites to provide me with news that is important to me--like important local news that may affect me personally. Like a big transformer fire, or such, that kills power to the local Internet POP and destabilizes routing. But, the Chicago Tribune didn't do that yesterday evening; instead I first saw the story on dslreports.com and linked there was a local story from a TV station.

Wednesday, June 15, 2005

Time to melt some bricks

Sam bought a surplus fresnel lens for me. It's June, mostly clear, and it's time to melt some bricks.

Tuesday, June 07, 2005

Plants in the near infrared


I always had thought that the bright white appearance of foliage in the near infrared was due to chlorophyll fluorescence--indeed, in a college class on plant structure and function, I recall examining a large beaker filled with chlorophyll dissolved in some alcohol, illuminated with a strong beam of light, that was deep red when viewed to the side.
You can see a spectrum of various vegetation here. Note how strongly plants begin to reflect at 700nm, which is near the far-red limit of vision. (You can see light beyond 800nm, if it's bright enough, but that's another post of OSHA violations and laser regs).

However, this remote sensing page shows that the high albedo of plants in the near infrared is actually just due to the cellular structure of the leaf. Plant structures are essentially transparent in the near-infrared, and the light is efficiently scattered in the air spaces beyond the first layer of cells. This has been compared to the mechanism that causes snow to be so white and reflective for a substance that is made up of transparent pieces. Newer leaves are not as thick and full of air gaps as mature leaves, and so should reflect less. The spongy mesophyll (what a great term, in my opinion), this interior area, allows for proper interchange of gases, and access to it is controlled by the stomata. Here is a (large) photomicrograph of a leaf cross-section: http://koning.ecsu.ctstateu.edu/Plants_Human/images/leafcslabel.jpg

http://www.storm.uni.edu/rs/2001/vh3.html

I took most of these photos over a month ago, when Chicago was experiencing spring, so the trees had small leaves. In many cases, the wind is blowing the trees around and ruining the multi-second exposures!


Tuesday, May 31, 2005

Visual/Infrared comparisons


This is a split screen image of Yerkes Observatory in the visual and near-infrared. I moved the camera in between images and wasn't planning in advance, but the comparison still works. You can see the pine tree turns white, the blue sky turns very dark, and the tones of the brickwork and dome sheeting subtly change.

Car Windows
Automobile windows, we are all taught, are wonderful examples of the greenhouse effect. Visible light streams in, is absorbed by the car's interior, and converted to heat. The thermal infrared light is then reradiated by the interior but unable to escape the glass, and the car heats up.

Manufacturers are well aware of this fact, and today's cars have a higher glass to surface ratio than older ones. Given this, why aren't we melting the plastics in the car?

We could tint the windows, to reduce the total light into the car, but this is dangerous at night, and is completely impractical for the windshield.

The answer is in the glass itself. Automotive glass contains a special additive to absorb near-infrared light. NIR is worthless to human vision, but can contribute significantly to the heat load of a car. (I can't remember the reference, but I've read it can be 50%).

Here is an image of a car that visually had no tinted windows; indeed, no one can opaque their windshield legally:


A spectral graph of a glass like that is here. (Link used to go to a nice graph but it's missing).

Currency
You can see that American currency has some sort of blank stripe code on the back of the new bills: http://www.lib.uchicago.edu/~dean/infrared/slides/IMG_4784.html.
I saw this at here; and then a simple search shows that it is no secret but a great anti-counterfeiting technique: http://www.accubanker.com/support/irmappings.phtml

Plants
These need a separate post.
P.S. Here's an image of a Linne statue with a false-color mapping.
My infrared gallery
IR hosta
Bushes in the near-IR

Sunday, May 22, 2005

Infrared gallery

I have placed most of the near infrared images I've taken at http://www.lib.uchicago.edu/~dean/infrared/.
All of the images were normalized with "Auto Levels" in Photoshop and desaturated to greyscale. The raw images are very purple and underexposed.


The filter material
was color negative film, fully exposed and processed, stacked
up in three. This sandwich is opaque to the eye except for
bright filaments. There is leakage around the sides of the filter when I place it on the camera lens, and since it's just negative film, there are significant reflections between the three pieces, creating a hotspot in the center of the frame.


In the camera, all three channels respond,
although the green is weaker than red and blue. The response
from all three channels must be the residual near-IR leakage
through the color filters, and scenes appear to be the same if
you compare each color channel. With a two layer sandwich you
begin to see more red light come through, and this creates a
neat contrast between near-infrared-red and near infrared:
http://www.lib.uchicago.edu/~dean/blog/ir2-auto.jpg. There is
a normal visual comparison at
http://www.lib.uchicago.edu/~dean/blog/ir-normal.jpg.
The exposures are roughly 1000x longer with the filter in bright sunlight.


In the next post, I'll discuss some interesting details about near-infrared light: plants, automotive windows, and currency.

And split screen comparisons with normal visual images.

Visual Infrared Comparisons
Plants in the near infrared
Linne Statue in the near infrared
IR bushes
IR hosta (or plantain lily)

Tuesday, May 17, 2005

Aurora photos from Yerkes Observatory

This Saturday members of the Ryerson Astronomical Society visited Yerkes Observatory to use the 41-inch reflector. Luckily the clouds cleared for observing until midnight or so, when the clouds reappeared. While taking a break, I noticed a faint glow low to the north, and assumed it was scattered light from the setting first quarter moon, but then I realized the moon was too far to the west for that to happen. Then the glow turned green, and I knew we had an aurora. The clouds cleared out, and we were treated to a fantastic display of the northern lights. It started out green and in the north, and spread overhead, where it suddenly changed color and we saw light pastel blue and violets in addition to the green. The display continued until dawn at 4AM.

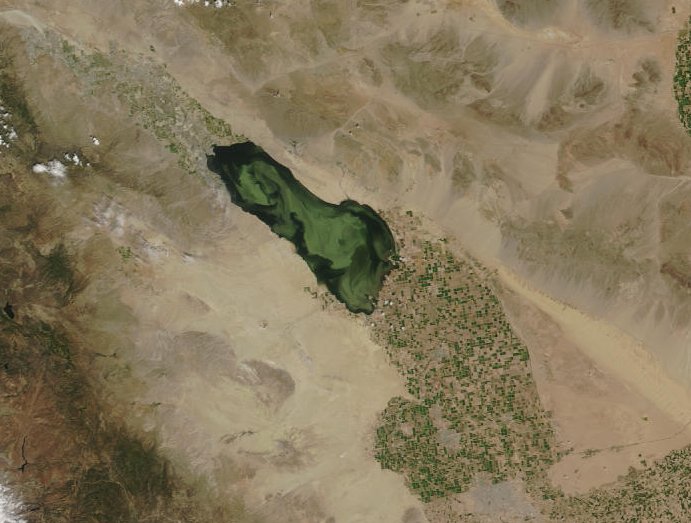
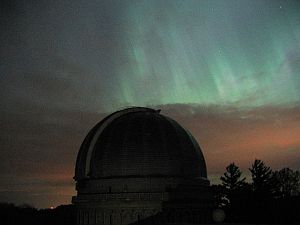
http://astro.uchicago.edu/RAS/rchive/yerkes-aurora/index.html

Tuesday, May 03, 2005

IR bushes


Plus, a graph of the transmission of fully exposed and developed color negative film, from recorded by here:

This helps explain how dust removal scanners with ICE work--the film dyes are transparent in the infrared, but dust isn't. An infrared scan of the negative shows a clear negative with only the dust visible. Silver grains in black and white film are uniformly opaque to light and so ICE won't work with it.

Saturday, April 30, 2005

Thursday, April 28, 2005

Another airline plot

This was a trip to Las Vegas. Maximum altitude was at 39,000ft, and the flightpath was a relatively northern one across Nebraska and Colorado, then turned south in Utah. We flew for a while in southern Utah at a lower altitude while getting into the inbound approach, and you can see that on the graph.

http://www.lib.uchicago.edu/~dean/blog/mdwtolas.jpg

Wednesday, April 27, 2005

more near-IR tests

I added a third layer of color negative to the filter, and this makes the sandwich completely opaque to the naked eye. The sun is barely visible (but not at all safe to look at) through it. I can get a reasonable if slightly underexposed image of open shaded areas with an exposure of 4 seconds at f/5.6 at ASA 400. With the third layer there is no difference between the red and blue filters, so I believe whatever I am getting is residual IR leakage.

http://www.lib.uchicago.edu/~dean/blog/reynoldsclub-ir.jpg


That isn't snow, it's grass.

A clue to what wavelengths we are seeing is the fact that the streetlight happened to be on, and we can see it, and HPS lights emit a very intense 819.3nm and 819.5nm doublet.

Monday, April 25, 2005

near-IR world

http://www.lib.uchicago.edu/~dean/blog/ir1.jpg
http://www.lib.uchicago.edu/~dean/blog/ir2.jpg
http://www.lib.uchicago.edu/~dean/blog/ir-normal.jpg
These were shot with a near-IR filter over my camera
(a near infrared filter being two pieces of fully exposed color negative film).

If you swap the RGB colors around, you can eventually get something almost, but not quite entirely unlike, normal. http://www.lib.uchicago.edu/~dean/ir2-rgb-bgr.jpg

Some more (post-processing):
http://www.lib.uchicago.edu/~dean/blog/ir1-auto.jpg


http://www.lib.uchicago.edu/~dean/blog/ir2-colorswap.jpg

From looking at the RGB histograms out of the camera, it appears that the red and blue filters let the most near-IR through. Traditionally this is the case. The red lets very near-IR through, and the blue lets in IR at double the blue wavelength (a 450nm blue filter will let in 900nm IR, e.g.). The blue channel shows the most chlorophyll fluorescence too.

Thursday, April 21, 2005

Lunar maria colors

A nice image of exaggerated maria colors on the Moon: http://www.rc-astro.com/img/moon_colors_2005-04-18_web.jpg.

Visually, you can see this, especially between Mare Serenitatis and Mare Tranquilatis (wow I can't believe I spelled that right the first time). They are the two prominent, quasi-circular touching maria on the left side. The color difference for maria basalts is the difference in composition of TiO2.

Tranquilatis, the bluer one, is very rich in TiO2.

Giguere, Thomas A.; Taylor, G. Jeffrey; Hawke, B. Ray; Lucey, Paul G.
The titanium contents of lunar mare basalts
Meteoritics & Planetary Science, vol. 35, no. 1, pp. 193-200 (2000).

Saturday, April 16, 2005

Another down

Another down. However, this rejection letter was very nice, as opposed to Arizona's. Mahalo, Hawaii.

Friday, April 15, 2005

I've been on vacation

I've been away. I didn't do much. I note that I heard many more stations in Nevada with an Icom R-71a in the 15 MHz and 17MHz broadcast bands than in Chicago. It probably proves that the old tube Hallicrafters S-40A needs work on stage 4, 15-40MHz. I heard Radio Netherlands on multiple frequencies, and it was neat to note one of the stations was 1/4 second behind the others. Steven and I have decided that proves it has 1 satellite hop extra to that relay station than the others. (Geosynchronous orbit is 23,000miles, roughly 1/8 light-second away). I bet stringing a simple wire out to the west edge of the roof (past the skylight) would give us a great signal and some immunity to the elevator noise. The current antennas, save for the magnetic one, aren't shielded and pick up noise (and signals too) from the coax braids, since they aren't correctly balanced.

Friday, March 11, 2005

VLF radio part 1

A long time ago I dabbled in Very Low Frequency radio. These are radio waves with frequencies under 20kHz. They have obscenely huge wavelengths and as a result can penetrate into "conductors" a significant distance before being absorbed/reflected. The Navy used to use VLF for communicating with submerged submarines at 76Hz and 58Hz. There is a navigational system located down near 100kHz called LORAN-C, and the WWVB signal at 60kHz. Lightning is the dominant natural signal in this wavelength band. But, nearly everything creates electrical noise down there. For instance, let's talk about switching power supplies.

Nowadays nearly everything is powered via a switching power supply, as opposed to a linear supply. What's the difference? A linear supply uses transformers to convert the AC running at 120 volts and 60Hz into a lower, often 13.8 Volts 60Hz AC. This is then rectified into pulsing DC via a set of diodes and smoothed out with capacitors. It's wasteful--a percentage of the power is lost via heating in the transformers. They have to be very large to keep the 60Hz oscillating magnetic field inside the transformer.

Switching power supplies first convert the AC into a high voltage DC (around 200-300V). Then, the DC is switched quickly on and off at a high frequency, often 50kHz or higher. This is then put into a much much smaller transformer since high frequency transformers can be much much smaller and still be efficient as a big transformer running at a lower frequency. On the other side, power requirements are measured and there is feedback to provide a pulse-width-modulated approach to supply the power needed.
http://mrtmag.com/mag/radio_switching_vs_linear/
gives a good overview.

Anyways, they are noisy. The world is a very noisy place in the VLF band.

Long ago, my friend John Crocker ran a 1000ft wire down the length of the Midway, stuck a ground rod into the earth, and placed a pair of high-impedance headphones in between. The VLF radio waves are directly converted into audio frequencies.

Read VLF Radio Part 2: Sferics

Wednesday, March 09, 2005

Pentax Takumar lens

I bought a 55mm f/1.8 Pentax screw mount lens off of Ebay last week to use as a wide-field imager in front of the Starlight Express SXV-H9 CCD camera. The total cost was $11. What I didn't expect was that the rear element of this lens was made with a thorium-rich glass. The radiation might preclude use of this lens. I get counts of 6000 microrem/hr with the counter at the surface of the element. I did some counting last night:

With the detector 2 cm away and 10 samples of 10 seconds each:
Bare: 2743
Single sheet of paper: 2466
Aluminum (1/16 inch thick): 577
Aluminum and paper: 563
With geiger counter reversed: 80
With geiger counter reversed and Al: 60
From side of geiger counter: 96
From side with Al: 87
Background count was 12.

Then, I did some distance counting.
Distance Count rate
2cm 2721
4cm 1145
6cm 647
8cm 391
10cm 282
12cm 203
14cm 165
16cm 130
18cm 98
20cm 87
22cm 80
24cm 57
26cm 59
28cm 47
30cm 38
32cm 42
...
40cm 26

I also measured the rates with the 1/16 inch thick Aluminum sheet in the way--this way, I was hoping for only the photonic component of the radiation, so no air absorption.
6cm 156
8cm 88
10cm 64
12cm 48
16cm 30
20cm 18

Graphs are needed, I know. I just wanted to post something. Everyone else is busy with end of quarter work.

Monday, February 28, 2005

Cosmochemistry laughs

It's amusing when while searching for a nice graph of the "Standard Abundance Distribution" that you end up on a website of a professor who studies such things, and the book lying open in your lap with the nice graph you only wish you could scan into a computer is by the same person.

Wednesday, February 23, 2005

Tuesday, February 22, 2005

Blue violet solar spectrum

I read somewhere most of the lines in the blue and violet were due to the gazillion transitions that iron's electrons have.


Click on the above image for a larger version.

Interestingly, in the camera there is more spectral detail in the red channel than the blue. (This is probably related to the fact that most dye filters will transmit light not only of the design wavelength but also double the wavelength--so a blue filter with a peak wavelength of 450nm will also transmit around 900nm.) Edit: While this effect occurs, it wouldn't appear in this instance. It should appear in the near infrared spectrum. After looking at the histogram it is clear the blue channel is totally saturated (aka overexposed). I bet the camera chooses the exposure mostly on what the green channel is seeing.

This is another project: I have the entire solar spectrum from slightly UV-ward of the calcium H & K lines at 400nm to somewhere near 750-800nm in the near-infrared imaged through my spectrograph and the Ryerson telescope. I want to combine the images into a long continuous image. My own solar spectrum.

Also see

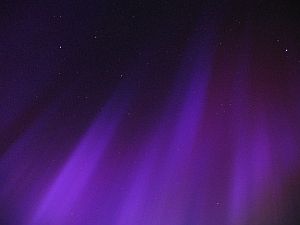
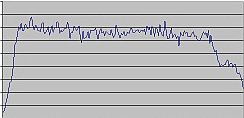
The Solar Spectrum -- Magnesium Triplet

Terrestrial Oxygen Red

The Sodium Doublet

Monday, February 21, 2005

Terrestrial oxygen

Terrestrial oxygen as seen in the sun's spectrum, originally taken March 17, 2003.


It's terrestrial only in the sense of being non-astronomical; to all but astronomers it would be called "atmospheric".

Sunday, February 20, 2005

Grad school applications

I haven't heard yea or nay from a single school yet, and the waiting is driving me crazy. How long must I wait? ASU has a visitation weekend March 6-8, but why bother visiting if they haven't said whether or not you are in or not? In March I am forcing myself to visit home, anyways; I desperately need to take a vacation.

In retrospect, waiting is probably a good thing, as this means
  1. I am not a highly competitive student (I already knew that) and
  2. I was not thrown out immediately.
Still, it wouldn't hurt if Chicago got its name and reputation out there a bit more, eh?

Saturday, February 19, 2005

Friday, February 18, 2005

No, really, I like astronomy more.

You might think from the first few entries in this web log that I'm currently obsessed with radioactivity. I'm not, and usually you can find me at the focus of a telescope. I was thinking of what is really stopping productive and easy use of the Ryerson telescope. Just last night, several problems happened:
1. The digital setting circles slipped off the declination.
2. The right ascension clutch (aka tracking) wouldn't work, or only occasionally would catch.
3. The dome slit was cranky.

All these things affect our motivation to observe, which is the whole reason of being for the RAS. If these items are causing problems, and they are, they need to be addressed and solved in a reasonable amount of time.

For #1, I can fix this easily by moving the setting circle up closer to the moving surface. Once it is done, it shouldn't ever be a problem again and we can get people to use the digital setting circles (designed to help people find stuff).

#2 See a comment below. I think a locknut is warranted, but I think Alex had determined there wasn't enough space for another nut. Can we get two thin nuts? Or, since the motion of the RA naturally loosens this nut, can we put a teflon washer in to help reduce friction?

#3 Physically characterizing the orientation of the metal bars that hold up and contain the slit rollers is important. Are they parallel and level? I recall shimming the bottom rail long ago to keep it level. Part of the problem with solving this is the inaccessibility of the parts, given some of them are 15 feet above the roof of a six-story building.

Oh, yes--the breakthrough last night was hearing parts moving when I tried to move the telescope in R.A. while locked--it gave me the idea to mentalize a force diagram. When the clutch is locked, what forces the scope to move? It's actually transmitted through the R.A. fine motion worm.

Dinosaur radiation

I have a little bit of dinosaur bone from a field course in Montana (taken legally, fyi) that is pretty radioactive. Uranium in groundwater will preferentially deposit in phosphates and organic material. Colin and I measured the bone tonight and used a matrix suggested by the geiger counter manufacturer to determine the content of the radiation.

The bare bone measured 181 uR/hr when placed just above the detector window.
It measured 170 uR/hr with a sheet of paper between the window and the bone (and a plastic bag).
With a 1/16inch thick sheet of aluminum, the count rate was 42 uR/hr (with plastic bag).
The rate was 15uR/hr from behind the detector and 12 uR/hr from the side. The background was ~14uR/hr.

This suggests 11uR/hr of alpha particles (helium nuclei);
128uR/hr of beta radiation (electrons); and
42uR/hr from gamma rays.

Thursday, February 17, 2005

Real time neutron monitor

http://ulysses.sr.unh.edu/NeutronMonitor/Misc/neutron2.html

Ground level neutrons are produced from secondary nuclear reactions occuring from primary cosmic rays hitting atmospheric atomic nuclei. The first neutron monitors were created as a result of John Simpson and his cosmic ray research at Chicago.

http://www.ngdc.noaa.gov/stp/SOLAR/COSMIC_RAYS/cosmic.html

Data table for 2004 at Climax, CO: ftp://ulysses.sr.unh.edu/NeutronMonitor/HourlyClimax/Climax2004

Wednesday, February 16, 2005

Exclusive: NASA Researchers Claim Evidence of Present Life on Mars

Thanks to Jason Robertson for the link.

In short, another NASA hyped-up press release with a speculative claim that has no solid data behind it. An Earth-analogue environment that explains a Martian gas fingerprint is not proof.


Saturday, February 12, 2005

Geiger counter photos


The clicker unit attached to the geiger counter


I made the clicker unit with robust design in mind. Therefore, I epoxied everything to the case and it looks really crappy, but it's not going to fall apart in someone's pocket. You can see the basic circuit--9 volt battery switched, which powers the counter through the phone jack. The detection indicator is a negative voltage swing on another line from the phone jack, which switches a PNP transistor. The transistor opens to allow current to flow through the potentiometer, the headphones, and the speaker. The LED is controlled directly by the indicator pulse, without transistor switching.

What's wrong with the design? The headphones should be bypassed when they aren't plugged in, but they aren't, so the speaker does not click without headphones. And, when the headphones are in, there isn't enough oomph to drive the 8 ohm speaker. I tried bypassing the headphones, but I didn't try until after I had assembled the unit, and everything was too cramped to solder.


P.S. What software tools do you use to generate nice schematics? Preferably free or open-source.

Wednesday, February 09, 2005

Radioactive Krypton in the atmosphere

The radioactivity of atmospheric krypton in 1949–1950
Anthony Turkevich, Lester Winsberg, Howard Flotow, and Richard M. Adams
http://www.pubmedcentral.nih.gov/articlerender.fcgi?artid=33711

Highlights:

"The work reported here was carried out in the old ruling engine room for grating production in the basement of the Ryerson Physics Laboratory of the University of Chicago."

"As mentioned earlier, atmospheric krypton in the 1990s has a radioactivity of tens of thousands of disintegrations per minute per liter. It is now about a hundred times more radioactive than the samples reported on here."

"The largest current producer of radioactive krypton is the French reprocessing plant at Cap-de-la-Hague, which released 1.8 × 10¹⁷ Bq of krypton radioactivity in 1994. If diluted by the whole world's atmosphere, this would produce a radioactivity of krypton of 2,400 dpm per liter (STP). Cap-de-la-Hague's output may represent about half of the present input into the atmosphere of this radioactive nuclide."

Alex Meadows' guide to anodizing

http://www.shadowguarddev.com/alex/anodizing/

Tuesday, February 08, 2005

Sky spectrum in Chicago

Chicago city lighting is nearly universally high pressure sodium (HPS). The street grid is lit with 310W Crimebusters on main aterials, 200W cobras on alleys, and 90W on side streets. New lights that get put in are 400W cobras on aterials and 150W or 250W on side streets. (Damnit! Way too much light, way too much glare. Put in full-cutoff lights and you can drop the wattage in half and get the same amount of light).

University of Chicago lighting is different. Most pedestrian lighting is mercury vapor. Newer floodlights have been metal halide.

If I took a spectrum of the light pollution, I could measure the strength of a sodium line and a mercury line and compare them to determine how much light pollution is from campus sources versus the city.

For this sort of spectroscopy I don't need a telescope--just a camera, grating, slit, and lens.


Monday, February 07, 2005

After Geiger comes the Proportional Counter

Proportional Counter: able to quantatively assess the energy level of gamma rays/X-rays.

Geiger Counter

I bought a Geiger counter as a birthday present for myself. It is an Aware Electronics RM-70. It is cheaper than traditional Geiger counters because it is designed to work with a computer. By itself, it does nothing. I built a 'clicker' unit that can power and provide the standard click response to radiation events. I need to:
1. photograph clicker unit.
2. publish schematic.
3. enjoy the fun of graphs!

http://www.lib.uchicago.edu/~dean/MDWtoLAX-radiation.gif

Southwest Airlines flight to LAX. I turned on the detector at roughly 12,000ft, and turned it off at the official 10,000ft announcement. According to the pilot cruising altitude was at 39,000ft. The big drop at 3/4 of the way across the graph was a temporary disconnection.


http://www.lib.uchicago.edu/~dean/radon15min.gif
This is the decay of radioactive daughter products of radon-222 being captured on a coffee filter that filtered 15 minutes of air through a vacuum cleaner in someone's basement in Ohio.


If you graph this curve on a logarithmic scale, you get this:


It's not quite straight, but the slope of the line gives you the exponent of the equation far below. The unreadable timescale is the same as the graph above it.

Radon-222-> Po-218 + alpha
Polonium-218-> Pb-214 + alpha
Lead-214-> Bi-214 + e-
Bismuth-214-> Po-214 + e-
Polonium-214-> Pb-210 + alpha

Questions I have that I haven't answered: What exactly is the software recording? What are those numbers? If I listen to the pulses, it seems the software multiplies the number of pulses by 4 to get the observed numbers, which it claims are microRads/hr. If this were a singular nuclear decay, I could deal with it, but it's 5 different decays. So how do I convert into pCi/L of radon? Why does it appear the half-life of the graph is nearly 50 minutes, which just happens to be the half-lifes of the first five decay products added together? Am I recording both the alpha particles and electrons/positrons, AND the gamma rays?
http://hps.org/publicinformation/ate/cat1.html

Simple EPA primer on radon: http://www.epa.gov/radiation/radionuclides/radon.htm
Uranium-238 decay chain: http://www.atral.com/U2381.html

Radioactive decay follows A=A(o)e^-kt, where A(0) is the inital amount of material, A is the amount at time t, and k is the decay constant. k is related to the half-life (t 1/2) by the following: (ln 2)/k=t. To get this equation, set A=1/2 of A(0) in the first equation, remove the A(0), take the natural log of both sides, and you're done.

There are lots of fun projects associated with a Geiger counter. Cosmic radiation is one (remind me to graph my week-long Ryerson graph). Live web server graph of current levels is another.

I have another graph of a more recent trip to LAX here.
New idea: Mass Spectrometer. Pretty simple idea, the devil is in the details. A Mass spectrometer (or mass spec for short) will separate out atoms based on their mass. Steps involved:
1. Evaporate sample.
2. Ionize sample.
3. Separate out all ions save +1 charged ones.
4. Accelerate ions.
5. Subject ions to uniform and strong magnetic field.
6. F=qvB, where q=charge, B=magnetic field strength, v=velocity. F=mv^2/r. Heavier ions will deflect less in the field.
7. Measure ions (by current, charge, impact, whatever).

I know some mass specs measure different masses by varying the field strength to sweep the ions by a single detector. A linear CCD (or other long detector) would be able to pick up multiple ions at once.

Measuring current seems too sensitive--can I measure nanoAmps? I know better the response of CCDs than anything else. But these are big particles that won't go far into the detector, and might get stuck in the control gates atop the silicon.

I wonder if I can get more sensitive results by increasing the length of the device. If the ions are deflected by say 0.1 degrees per amu, but I can't see that, I could lengthen the travel distance and they would separate out further on the detector.

Vacuum--a problem since I have no experience.

Can I build a miniuature mass spec using a new technology magnet (i.e., hard drive magnet)?

http://hyperphysics.phy-astr.gsu.edu/hbase/magnetic/maspec.html
http://www.chemguide.co.uk/analysis/masspec/howitworks.html

Sunday, February 06, 2005

The rationale.

I needed a place to write down all my thoughts about projects I'm doing, did, or am thinking about doing. (The DodATAD triad). These projects are usually quasi-scientific in nature--my adventures with a Geiger counter and liters and liters of radon infested basement air, for example. Or a place to remind myself to smelt the hematite (fe2O3) and magnetite (Fe3O4) sands I have into iron, to produce my own personal Iron Age. Got it?

This is a test of a new blog entry.

A first entry into the blog--just to see how it works.