Monday, February 28, 2005
Cosmochemistry laughs
It's amusing when while searching for a nice graph of the "Standard Abundance Distribution" that you end up on a website of a professor who studies such things, and the book lying open in your lap with the nice graph you only wish you could scan into a computer is by the same person.
Saturday, February 26, 2005

Friday, February 25, 2005
Wednesday, February 23, 2005
Tuesday, February 22, 2005
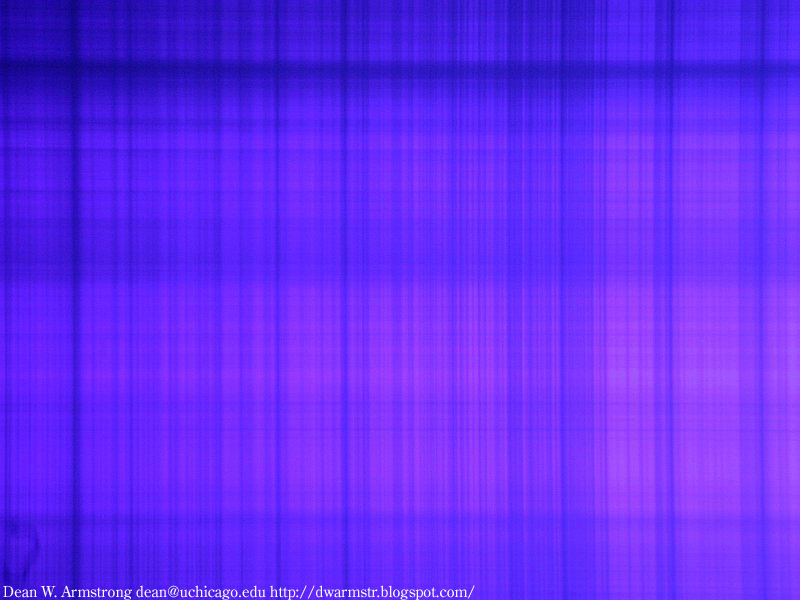
Blue violet solar spectrum
I read somewhere most of the lines in the blue and violet were due to the gazillion transitions that iron's electrons have.
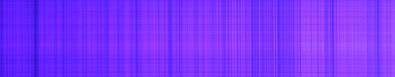
Click on the above image for a larger version.
Interestingly, in the camera there is more spectral detail in the red channel than the blue. (This is probably related to the fact that most dye filters will transmit light not only of the design wavelength but also double the wavelength--so a blue filter with a peak wavelength of 450nm will also transmit around 900nm.) Edit: While this effect occurs, it wouldn't appear in this instance. It should appear in the near infrared spectrum. After looking at the histogram it is clear the blue channel is totally saturated (aka overexposed). I bet the camera chooses the exposure mostly on what the green channel is seeing.
This is another project: I have the entire solar spectrum from slightly UV-ward of the calcium H & K lines at 400nm to somewhere near 750-800nm in the near-infrared imaged through my spectrograph and the Ryerson telescope. I want to combine the images into a long continuous image. My own solar spectrum.
Also see
 The Solar Spectrum -- Magnesium Triplet
 Terrestrial Oxygen Red
 The Sodium Doublet
Click on the above image for a larger version.
Interestingly, in the camera there is more spectral detail in the red channel than the blue. (
This is another project: I have the entire solar spectrum from slightly UV-ward of the calcium H & K lines at 400nm to somewhere near 750-800nm in the near-infrared imaged through my spectrograph and the Ryerson telescope. I want to combine the images into a long continuous image. My own solar spectrum.
Also see
The Solar Spectrum -- Magnesium TripletTerrestrial Oxygen RedThe Sodium Doublet
Monday, February 21, 2005
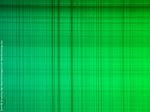
Terrestrial oxygen
Terrestrial oxygen as seen in the sun's spectrum, originally taken March 17, 2003.

It's terrestrial only in the sense of being non-astronomical; to all but astronomers it would be called "atmospheric".
It's terrestrial only in the sense of being non-astronomical; to all but astronomers it would be called "atmospheric".
Sunday, February 20, 2005
Grad school applications
I haven't heard yea or nay from a single school yet, and the waiting is driving me crazy. How long must I wait? ASU has a visitation weekend March 6-8, but why bother visiting if they haven't said whether or not you are in or not? In March I am forcing myself to visit home, anyways; I desperately need to take a vacation.
In retrospect, waiting is probably a good thing, as this means
In retrospect, waiting is probably a good thing, as this means
- I am not a highly competitive student (I already knew that) and
- I was not thrown out immediately.
Saturday, February 19, 2005
Friday, February 18, 2005
No, really, I like astronomy more.
You might think from the first few entries in this web log that I'm currently obsessed with radioactivity. I'm not, and usually you can find me at the focus of a telescope. I was thinking of what is really stopping productive and easy use of the Ryerson telescope. Just last night, several problems happened:
1. The digital setting circles slipped off the declination.
2. The right ascension clutch (aka tracking) wouldn't work, or only occasionally would catch.
3. The dome slit was cranky.
All these things affect our motivation to observe, which is the whole reason of being for the RAS. If these items are causing problems, and they are, they need to be addressed and solved in a reasonable amount of time.
For #1, I can fix this easily by moving the setting circle up closer to the moving surface. Once it is done, it shouldn't ever be a problem again and we can get people to use the digital setting circles (designed to help people find stuff).
#2 See a comment below. I think a locknut is warranted, but I think Alex had determined there wasn't enough space for another nut. Can we get two thin nuts? Or, since the motion of the RA naturally loosens this nut, can we put a teflon washer in to help reduce friction?
#3 Physically characterizing the orientation of the metal bars that hold up and contain the slit rollers is important. Are they parallel and level? I recall shimming the bottom rail long ago to keep it level. Part of the problem with solving this is the inaccessibility of the parts, given some of them are 15 feet above the roof of a six-story building.
Oh, yes--the breakthrough last night was hearing parts moving when I tried to move the telescope in R.A. while locked--it gave me the idea to mentalize a force diagram. When the clutch is locked, what forces the scope to move? It's actually transmitted through the R.A. fine motion worm.
Dinosaur radiation
I have a little bit of dinosaur bone from a field course in Montana (taken legally, fyi) that is pretty radioactive. Uranium in groundwater will preferentially deposit in phosphates and organic material. Colin and I measured the bone tonight and used a matrix suggested by the geiger counter manufacturer to determine the content of the radiation.
The bare bone measured 181 uR/hr when placed just above the detector window.
It measured 170 uR/hr with a sheet of paper between the window and the bone (and a plastic bag).
With a 1/16inch thick sheet of aluminum, the count rate was 42 uR/hr (with plastic bag).
The rate was 15uR/hr from behind the detector and 12 uR/hr from the side. The background was ~14uR/hr.
This suggests 11uR/hr of alpha particles (helium nuclei);
128uR/hr of beta radiation (electrons); and
42uR/hr from gamma rays.
Thursday, February 17, 2005
Real time neutron monitor
http://ulysses.sr.unh.edu/NeutronMonitor/Misc/neutron2.html
Ground level neutrons are produced from secondary nuclear reactions occuring from primary cosmic rays hitting atmospheric atomic nuclei. The first neutron monitors were created as a result of John Simpson and his cosmic ray research at Chicago.
http://www.ngdc.noaa.gov/stp/SOLAR/COSMIC_RAYS/cosmic.html
Data table for 2004 at Climax, CO: ftp://ulysses.sr.unh.edu/NeutronMonitor/HourlyClimax/Climax2004
Wednesday, February 16, 2005
Exclusive: NASA Researchers Claim Evidence of Present Life on Mars
Thanks to Jason Robertson for the link.
In short, another NASA hyped-up press release with a speculative claim that has no solid data behind it. An Earth-analogue environment that explains a Martian gas fingerprint is not proof.
Thanks to Jason Robertson for the link.
In short, another NASA hyped-up press release with a speculative claim that has no solid data behind it. An Earth-analogue environment that explains a Martian gas fingerprint is not proof.
Saturday, February 12, 2005
Geiger counter photos
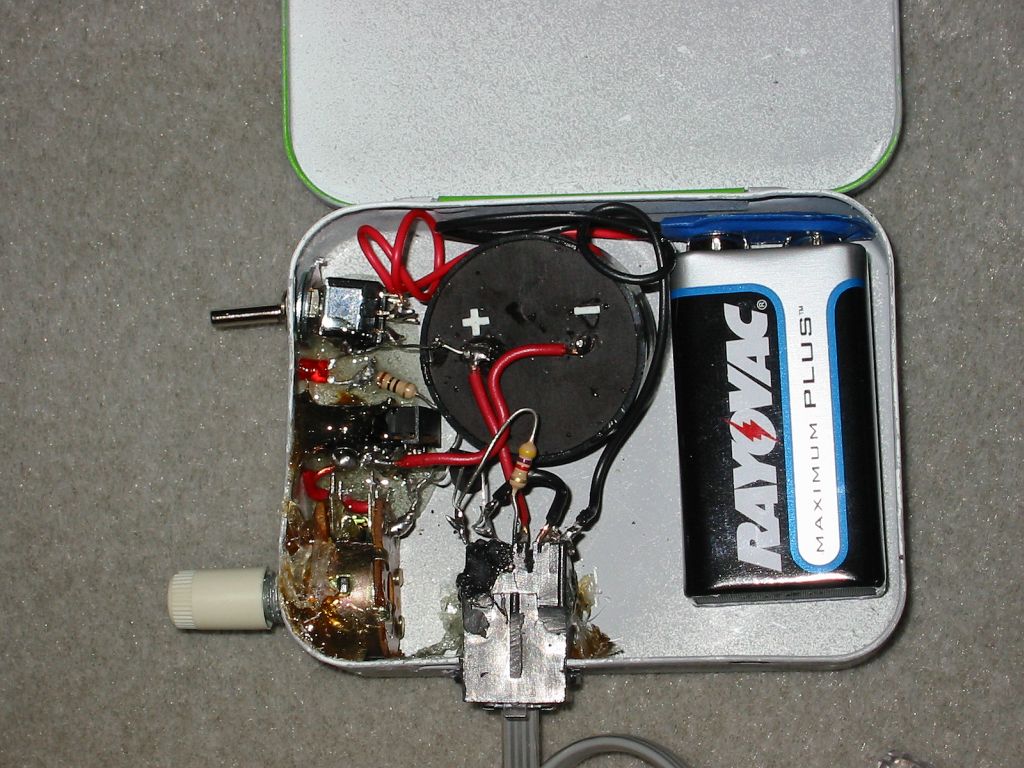
The clicker unit attached to the geiger counter
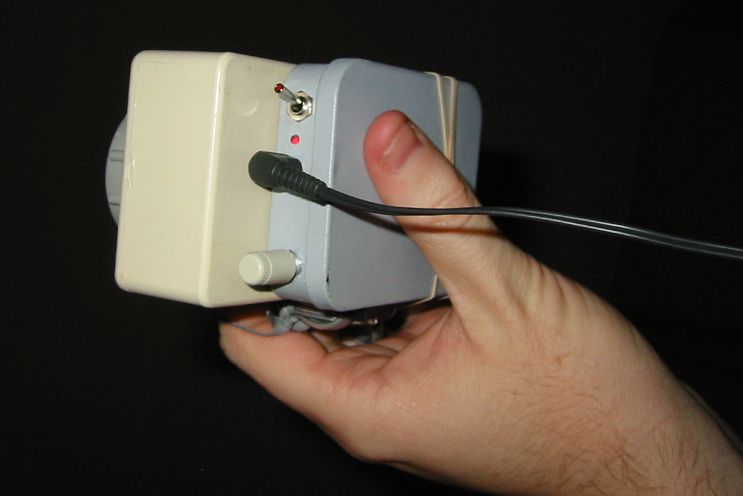
I made the clicker unit with robust design in mind. Therefore, I epoxied everything to the case and it looks really crappy, but it's not going to fall apart in someone's pocket. You can see the basic circuit--9 volt battery switched, which powers the counter through the phone jack. The detection indicator is a negative voltage swing on another line from the phone jack, which switches a PNP transistor. The transistor opens to allow current to flow through the potentiometer, the headphones, and the speaker. The LED is controlled directly by the indicator pulse, without transistor switching.
What's wrong with the design? The headphones should be bypassed when they aren't plugged in, but they aren't, so the speaker does not click without headphones. And, when the headphones are in, there isn't enough oomph to drive the 8 ohm speaker. I tried bypassing the headphones, but I didn't try until after I had assembled the unit, and everything was too cramped to solder.
P.S. What software tools do you use to generate nice schematics? Preferably free or open-source.
Wednesday, February 09, 2005
Radioactive Krypton in the atmosphere
The radioactivity of atmospheric krypton in 1949–1950
Anthony Turkevich, Lester Winsberg, Howard Flotow, and Richard M. Adams
http://www.pubmedcentral.nih.gov/articlerender.fcgi?artid=33711
Highlights:
"The work reported here was carried out in the old ruling engine room for grating production in the basement of the Ryerson Physics Laboratory of the University of Chicago."
"As mentioned earlier, atmospheric krypton in the 1990s has a radioactivity of tens of thousands of disintegrations per minute per liter. It is now about a hundred times more radioactive than the samples reported on here."
"The largest current producer of radioactive krypton is the French reprocessing plant at Cap-de-la-Hague, which released 1.8 × 10¹⁷ Bq of krypton radioactivity in 1994. If diluted by the whole world's atmosphere, this would produce a radioactivity of krypton of 2,400 dpm per liter (STP). Cap-de-la-Hague's output may represent about half of the present input into the atmosphere of this radioactive nuclide."
Tuesday, February 08, 2005
Sky spectrum in Chicago
Chicago city lighting is nearly universally high pressure sodium (HPS). The street grid is lit with 310W Crimebusters on main aterials, 200W cobras on alleys, and 90W on side streets. New lights that get put in are 400W cobras on aterials and 150W or 250W on side streets. (Damnit! Way too much light, way too much glare. Put in full-cutoff lights and you can drop the wattage in half and get the same amount of light).
University of Chicago lighting is different. Most pedestrian lighting is mercury vapor. Newer floodlights have been metal halide.
If I took a spectrum of the light pollution, I could measure the strength of a sodium line and a mercury line and compare them to determine how much light pollution is from campus sources versus the city.
For this sort of spectroscopy I don't need a telescope--just a camera, grating, slit, and lens.
Monday, February 07, 2005
After Geiger comes the Proportional Counter
Proportional Counter: able to quantatively assess the energy level of gamma rays/X-rays.
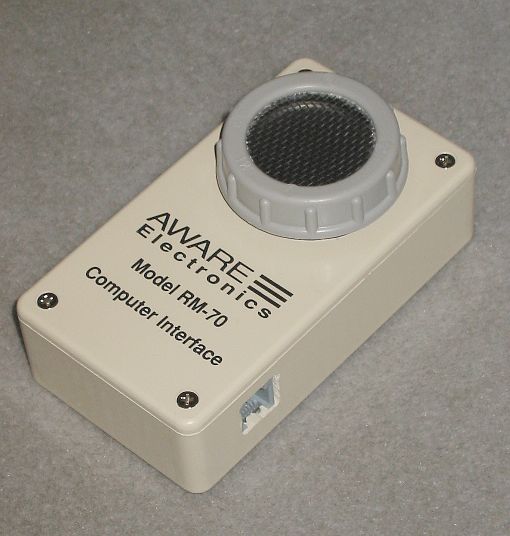
Geiger Counter
I bought a Geiger counter as a birthday present for myself. It is an Aware Electronics RM-70. It is cheaper than traditional Geiger counters because it is designed to work with a computer. By itself, it does nothing. I built a 'clicker' unit that can power and provide the standard click response to radiation events. I need to:
1. photograph clicker unit.
2. publish schematic.
3. enjoy the fun of graphs!
http://www.lib.uchicago.edu/~dean/MDWtoLAX-radiation.gif
Southwest Airlines flight to LAX. I turned on the detector at roughly 12,000ft, and turned it off at the official 10,000ft announcement. According to the pilot cruising altitude was at 39,000ft. The big drop at 3/4 of the way across the graph was a temporary disconnection.
http://www.lib.uchicago.edu/~dean/radon15min.gif
This is the decay of radioactive daughter products of radon-222 being captured on a coffee filter that filtered 15 minutes of air through a vacuum cleaner in someone's basement in Ohio.
If you graph this curve on a logarithmic scale, you get this:
It's not quite straight, but the slope of the line gives you the exponent of the equation far below. The unreadable timescale is the same as the graph above it.
Radon-222-> Po-218 + alpha
Polonium-218-> Pb-214 + alpha
Lead-214-> Bi-214 + e-
Bismuth-214-> Po-214 + e-
Polonium-214-> Pb-210 + alpha
Questions I have that I haven't answered: What exactly is the software recording? What are those numbers? If I listen to the pulses, it seems the software multiplies the number of pulses by 4 to get the observed numbers, which it claims are microRads/hr. If this were a singular nuclear decay, I could deal with it, but it's 5 different decays. So how do I convert into pCi/L of radon? Why does it appear the half-life of the graph is nearly 50 minutes, which just happens to be the half-lifes of the first five decay products added together? Am I recording both the alpha particles and electrons/positrons, AND the gamma rays?
http://hps.org/publicinformation/ate/cat1.html
Simple EPA primer on radon: http://www.epa.gov/radiation/radionuclides/radon.htm
Uranium-238 decay chain: http://www.atral.com/U2381.html
Radioactive decay follows A=A(o)e^-kt, where A(0) is the inital amount of material, A is the amount at time t, and k is the decay constant. k is related to the half-life (t 1/2) by the following: (ln 2)/k=t. To get this equation, set A=1/2 of A(0) in the first equation, remove the A(0), take the natural log of both sides, and you're done.
There are lots of fun projects associated with a Geiger counter. Cosmic radiation is one (remind me to graph my week-long Ryerson graph). Live web server graph of current levels is another.
I have another graph of a more recent trip to LAX here.
New idea: Mass Spectrometer. Pretty simple idea, the devil is in the details. A Mass spectrometer (or mass spec for short) will separate out atoms based on their mass. Steps involved:
1. Evaporate sample.
2. Ionize sample.
3. Separate out all ions save +1 charged ones.
4. Accelerate ions.
5. Subject ions to uniform and strong magnetic field.
6. F=qvB, where q=charge, B=magnetic field strength, v=velocity. F=mv^2/r. Heavier ions will deflect less in the field.
7. Measure ions (by current, charge, impact, whatever).
I know some mass specs measure different masses by varying the field strength to sweep the ions by a single detector. A linear CCD (or other long detector) would be able to pick up multiple ions at once.
Measuring current seems too sensitive--can I measure nanoAmps? I know better the response of CCDs than anything else. But these are big particles that won't go far into the detector, and might get stuck in the control gates atop the silicon.
I wonder if I can get more sensitive results by increasing the length of the device. If the ions are deflected by say 0.1 degrees per amu, but I can't see that, I could lengthen the travel distance and they would separate out further on the detector.
Vacuum--a problem since I have no experience.
Can I build a miniuature mass spec using a new technology magnet (i.e., hard drive magnet)?
http://hyperphysics.phy-astr.gsu.edu/hbase/magnetic/maspec.html
http://www.chemguide.co.uk/analysis/masspec/howitworks.html
Sunday, February 06, 2005
The rationale.
I needed a place to write down all my thoughts about projects I'm doing, did, or am thinking about doing. (The DodATAD triad). These projects are usually quasi-scientific in nature--my adventures with a Geiger counter and liters and liters of radon infested basement air, for example. Or a place to remind myself to smelt the hematite (fe2O3) and magnetite (Fe3O4) sands I have into iron, to produce my own personal Iron Age. Got it?
Subscribe to:
Posts (Atom)