
Showing posts with label radar. Show all posts
Showing posts with label radar. Show all posts
Thursday, April 01, 2021
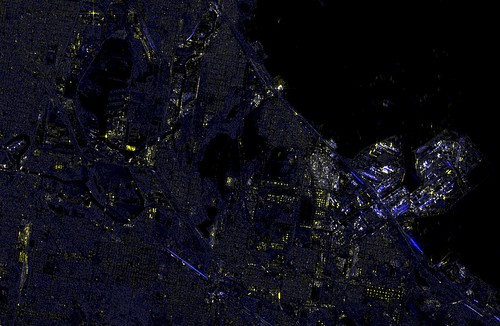
Image of Chicago's South Side with Synthetic Aperture Radar
This is from Sentinel-1 taken on March 22nd, 2021.

Monday, August 27, 2018
Burning Man in Synthetic Aperture Radar
I downloaded the Sentinel-1 Synthetic Aperture Radar data of the Black Rock area taken on August 19, and the start of Burning Man work is apparent. The colors represent different polarizations of the returns. This is a very small subset of the original 25000x16000 pixel image.
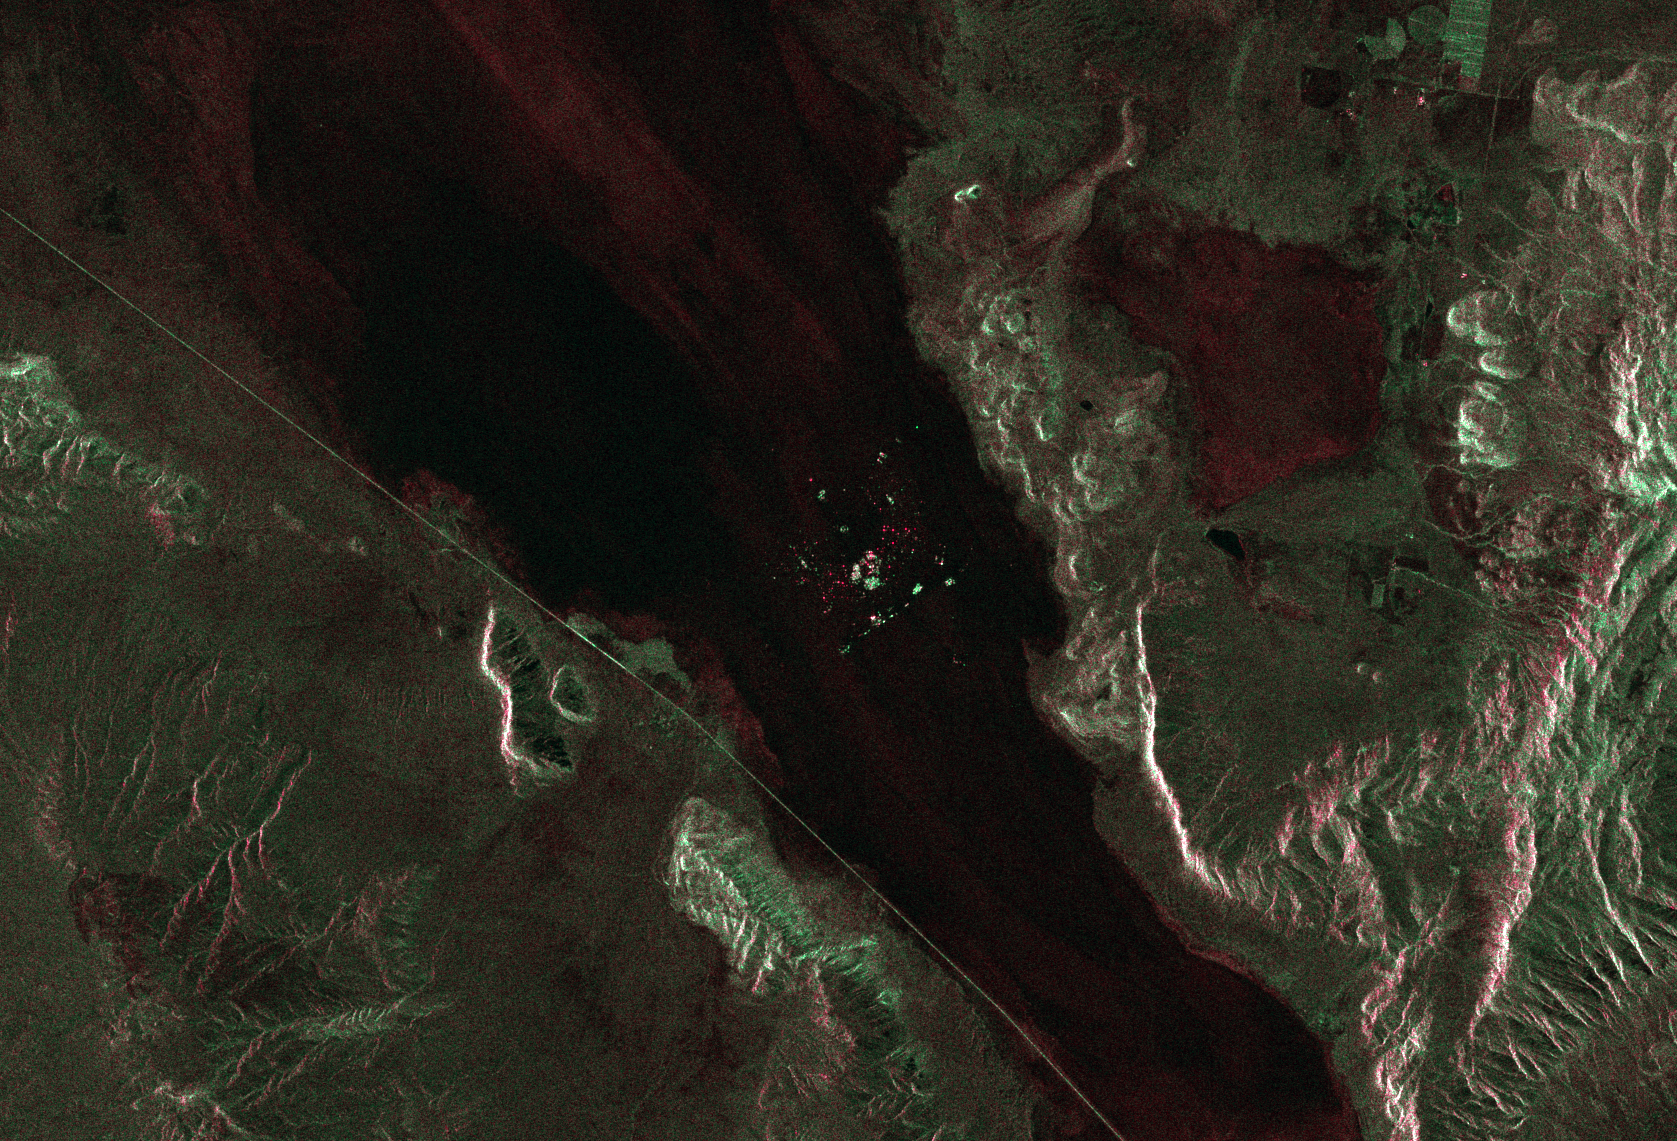 Also found this one from the 24th (horizontally flipped to correct)

Friday, July 13, 2018
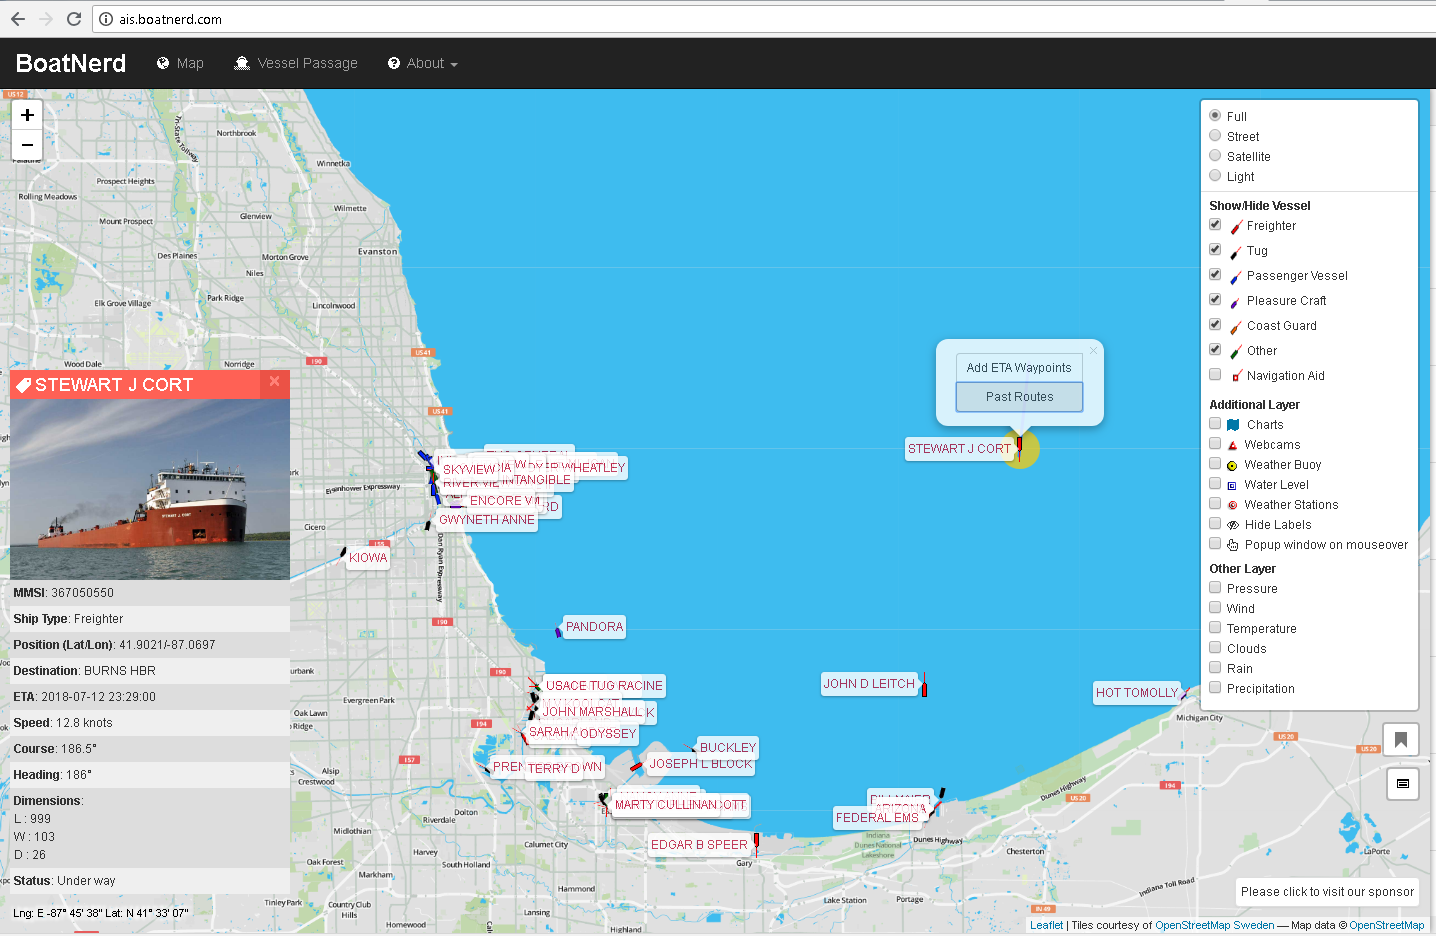
Freighter visible on weather radar
The Terminal Doppler Weather Radar system for Midway Airport caught the freighter Stewart J. Cort traveling on Lake Michigan towards Burns Harbor, IN. It's the return out in the middle of the lake heading south. I ID'd the ship with AIS Boatnerd
Wednesday, May 04, 2016
Revisiting the Lake Geneva SAR image
I realized my first processing of the Sentinel 1A radar image of Walworth County, WI, was deficient and I lost a lot of the details, so here's a much better grab of the HH channel.


Monday, May 02, 2016
SAR image of the Calumet region of Chicago
I've been working on manipulating the large images offered by the Sentinel satellite. I found an image of the city of Chicago region on April 10th, 2016, and have been taking a look at it. The data image is 25000x16000. I grabbed the HH(the Horizontal transmitted, horizontal received polarization) and HV images (horizontally transmitted, returned vertical polarization), normalized them and made them R and B in an RGB set. The G I created by adding the two images together. Adjusting the hue allows for greater visual impact of the image.
This is the Calumet region of southeast Chicago and Northwest Indiana, a heavily industrialized region. Lake Calumet, Lake Michigan, Wolf Lake, and the Calumet River/Cal Sag all show with no reflectivity at this normalization (you'll recall the previous post where Lake Geneva had some return from waves). The ArcelorMittal steelworks sits out on the right as a highly reflective region of pipes, stacks, rail cars and other industrialness, with the BP Whiting refinery to the left of it as another nearly continuous return. Long linear blue streaks are presumed oil or ethanol conveys consisting of mile-long packs of tanker cars that are bright in the HV channel. Shipping containers, barges, oil tanks and rail cars that are not tankers all reflect highly in the HH return. Even Binions Horseshoe floating casino shows up brightly. A bright return in the upper left I assume is the tower at Promet steel.
Wednesday, April 27, 2016
Synthetic Aperture Radar data of Lake Geneva, Wisconsin
I happened upon a nice description of how to grab data off of the ESA's Sentinel satellite via Evan Appelgate and there's a bunch of interesting things in the data. It was taken just this Tuesday morning at 7:11AM. The winds were out of the north at 8MPH and overcast. You can see in the image the effect of the wind creating a rougher, more radar scattering surface on Lake Geneva--dark at the north shore, transitioning to a very slightly rougher surface to the south.


Click to enlarge. There's a lot more interesting things to look at--that's just the first thing that jumped out at me.
Wednesday, December 17, 2008
a very simple 2.4GHz meter

I built a very simple meter that reads the strength of radio energy in its vicinity, without amplification or anything fancy. It picks up radio waves roughly around 1 to 3 gigahertz. It does very well in detecting cell phones, microwave ovens, and wireless access points.
On a simple level, the antenna converts radio waves into an electrical AC voltage, which is then converted by the germanium diode into a pulsing DC voltage. A capacitor stores the pulses and smooths out the pulsing and leaves a very small DC voltage, which is measured directly at a tiny multimeter I picked up at American Science and Surplus. I set the meter to DC voltage, 200mV scale.
The biquad antenna is sensitive to vertically polarized waves and slightly directional as well. A lot of designs also stick a ground plane behind it to increase the directionality, but I was looking for more of a field strength probe, rather than having an antenna that got me the most gain. It's a trade-off since the detector is so simple and without amplification, but that's what you get.

What can we measure with this meter? My standard test suite for gigahertz-ish radio frequencies is delinquent*, so all I can think of is cell phones, microwave ovens, and wireless networking. I found that the office microwave oven puts much more energy out at the hinge side of the door and a fan vent on the side than it does the meshed window. It can saturate the meter at the 200mV scale (when right next to the fan vent). Cell phones periodically check in with their towers (you can also tell this with a set of computer speakers anywhere near a GSM phone). They also do put out a bit of gigahertz radiation; I can detect them sending text messages from about six feet away and more when talking--they can also reach 200mV. Wireless 802.11b and g networks are actually pretty low-power in the scheme of things--they hard to see except close-up until they are transmitting data; then I can detect them six or so feet away. During idle they emit a "beacon" 10 times a second. The wifi antennas are also a good source for checking the polarization of the biquad--I get nearly nothing from them if I rotate the receiving antenna 90 degrees.

Outside the signal level varies greatly. There is a pervasive field which is presumably cellular networks and the addition of all the 802.11b/g/n networks. On the University of Chicago campus near the Regenstein Library the average strength varies from 0.2mV to 0.6mV, with a couple of spikes to 1.0mV. There are also areas of much stronger than ambient. For instance, outside of the Medici on 57th street the average field strength is 2-3mV and peaks at moments at 8mV. There are cellular tower antennas on a school across the street; so it seems likely the area is getting a particular sector of the tower.
I used this Field Strength Meter for 2.4 Ghz Wireless LAN as the excellent template for the project. For my version I used a standard 1N34A germanium diode--this is a more sensitive diode, and turns on at 0.3V instead of 0.6V like a standard silicon diode. I painted the diode black, as the diode proved to be photo-sensitive (all PN junctions are light-sensitive, and ones in transparent glass tubes even more so). Also, I didn't tune the capacitance at all. I then ran two wires to the inside plugs and drilled a hole in the case and hot-glued the antenna to the front of the meter. It's nice and compact, although the GP23A 12V battery in it doesn't last very long.
I could see easy modifications of this system, putting a simple FET amplifier or such to increase the meter response. If I use one of the inexpensive multimeters from Harbor Freight I might have enough room for a prebuilt circuit and a more directional antenna. I'd also like to see if I can pick up both aviation and weather radars with such a simple system. Maybe I should make a Sardine Can antenna?
*delinquent is also a synonym for nonexistent.
Thursday, May 24, 2007
Harvey fire smoke plume on radar
A large fire in south suburban Harvey (Chicago) is producing enough particulates to produce a visible return on the clear-air NEXRAD radar system extending out over the lake.

Images from NWS/NOAA via http://weathorr.com
Images from NWS/NOAA via http://weathorr.com
Monday, December 19, 2005
The Sun as a 2.4 GHz source, redux.
I previously wrote an entry about how you can see the Sun interfering with the weather radar at sunrise and sunset, seen here. The weather radar uses radio waves at about 3 GHz. Seen linked at Hackaday is a 2.4GHZ field strength meter using a microwave diode, a few capacitors and a simple "quad" antenna and measured using a digital multimeter. They report that the Sun generates a reading on their device!
Thursday, June 30, 2005
The sun as a microwave source
The Sun is a convenient source of radio waves. You can see this yourself by watching weather radar around sunrise or sunset. Radar works by emitting a very short pulse of microwave radiation. Then it listens for the weak returns for a short time (since a radar beam is line of sight, there is no point is listening for returns past 200 miles or so because of the curvature of the earth, or roughly 1 millisecond). The time it takes to hear the return gives you the "range" or distance to the object that reflected the beam. When the sun is low on the horizon, the radar receiver picks up the radiation as if it were a continuous return, and it's visible on all of the weather radars.
The image is of the radar from St. Louis last night at 8:28 PM CDT. You can see how the weather radar interprets a continuous return as if there were stronger reflectors further out, and how far north the sun is at this time of year near the summer solstice.
Subscribe to:
Posts (Atom)