One of the things I've always been interested in was radio; and part of that was scanning as much of the radio spectrum as possible to hear what was out there. As a kid, this was my father's shortwave receiver; I spent hours twirling the giant frequency handwheel on that radio absorbing every foreign radio broadcast I heard and wondering what the various weird noises I heard were.
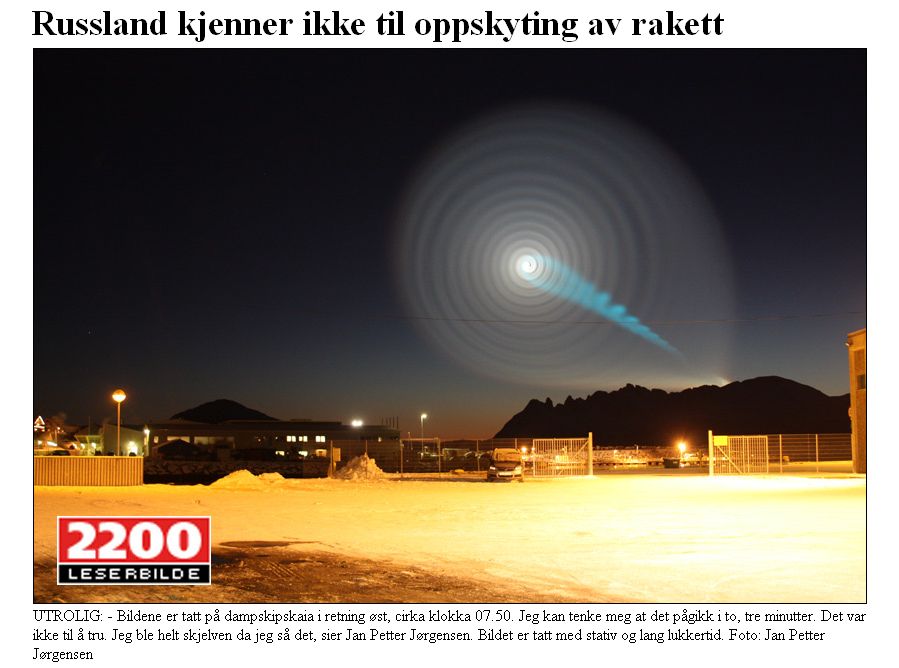
For instance, at times there would be a overwhelmingly loud, rapid "thump-thump-thump" noise that was fairly broadband across a few megahertz. I asked my father about that and he called it the "Russian Woodpecker", an over-the-horizon radar system that used frequencies that were normally used by shortwave broadcasters. If I stayed up long enough at night, I would begin to pick up the European broadcasters waking up at dawn with their early morning news broadcasts.
One thing about most radios is you are only tuned to one frequency at a time. You get a limited amount of bandwidth around that frequency depending on how the radio works. It's hard hence to compare the strengths of two stations simultaneously without resorting to memory tricks or rapid tuning.
With a fancy piece of equipment called a spectrum analyzer, you can see a wide range of frequencies at once and see various radio stations, peaks, etc. To some extent you can do this with a PC sound card hooked up to the audio output of the radio, but again you are limited in bandwidth. See the laptop display below, for instance.
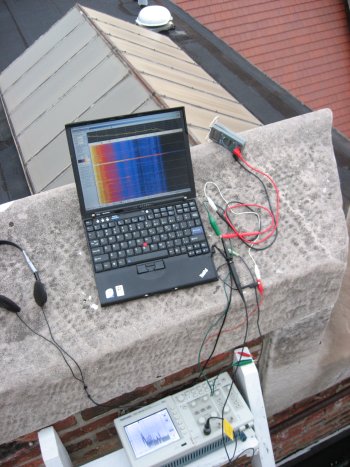 The generalized setup. An antenna, a diode detector, and an oscilloscope. The PC is not being used in this particular example.
What amazes me is a sub-$1000 digital oscilloscope that is advertised as a 40MHz scope, that is, it can display signals up to 40MHz in frequency, can in a FFT mode display the signals up to 500MHz and essentially function as a spectrum analyzer.
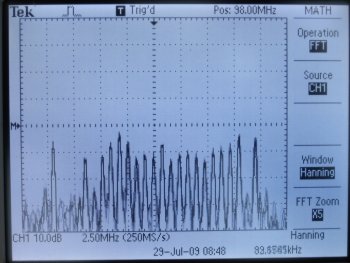
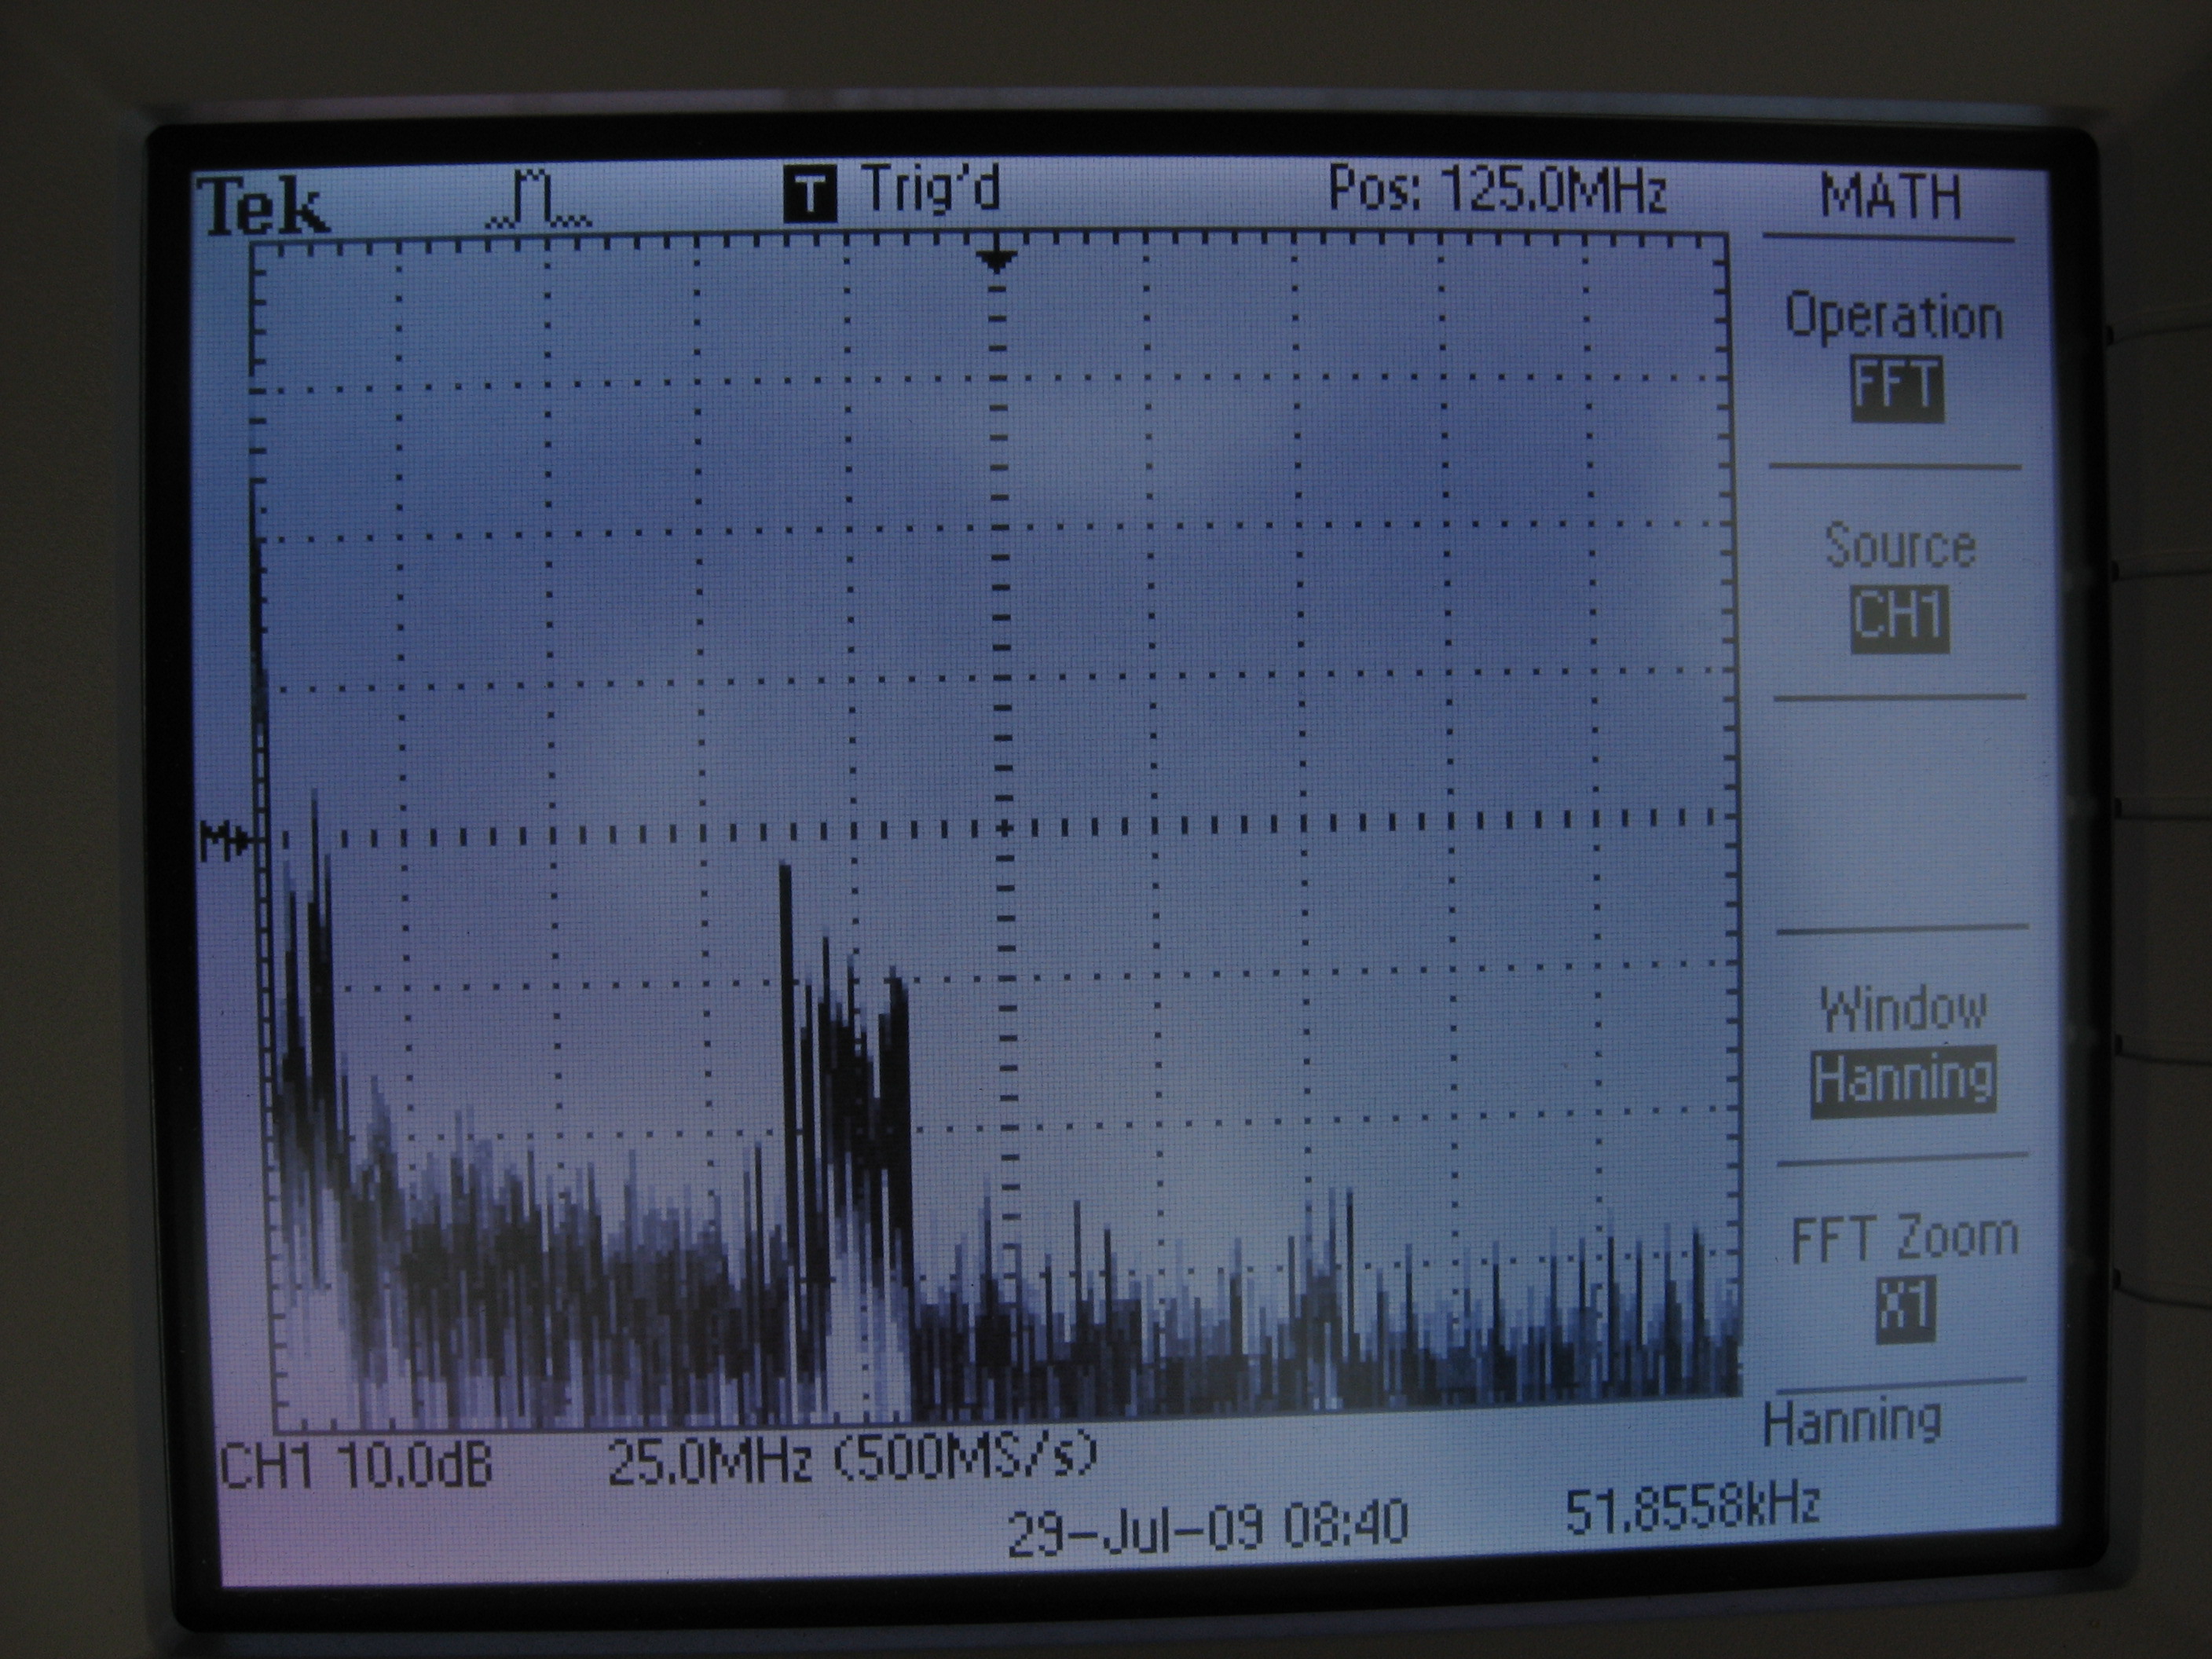
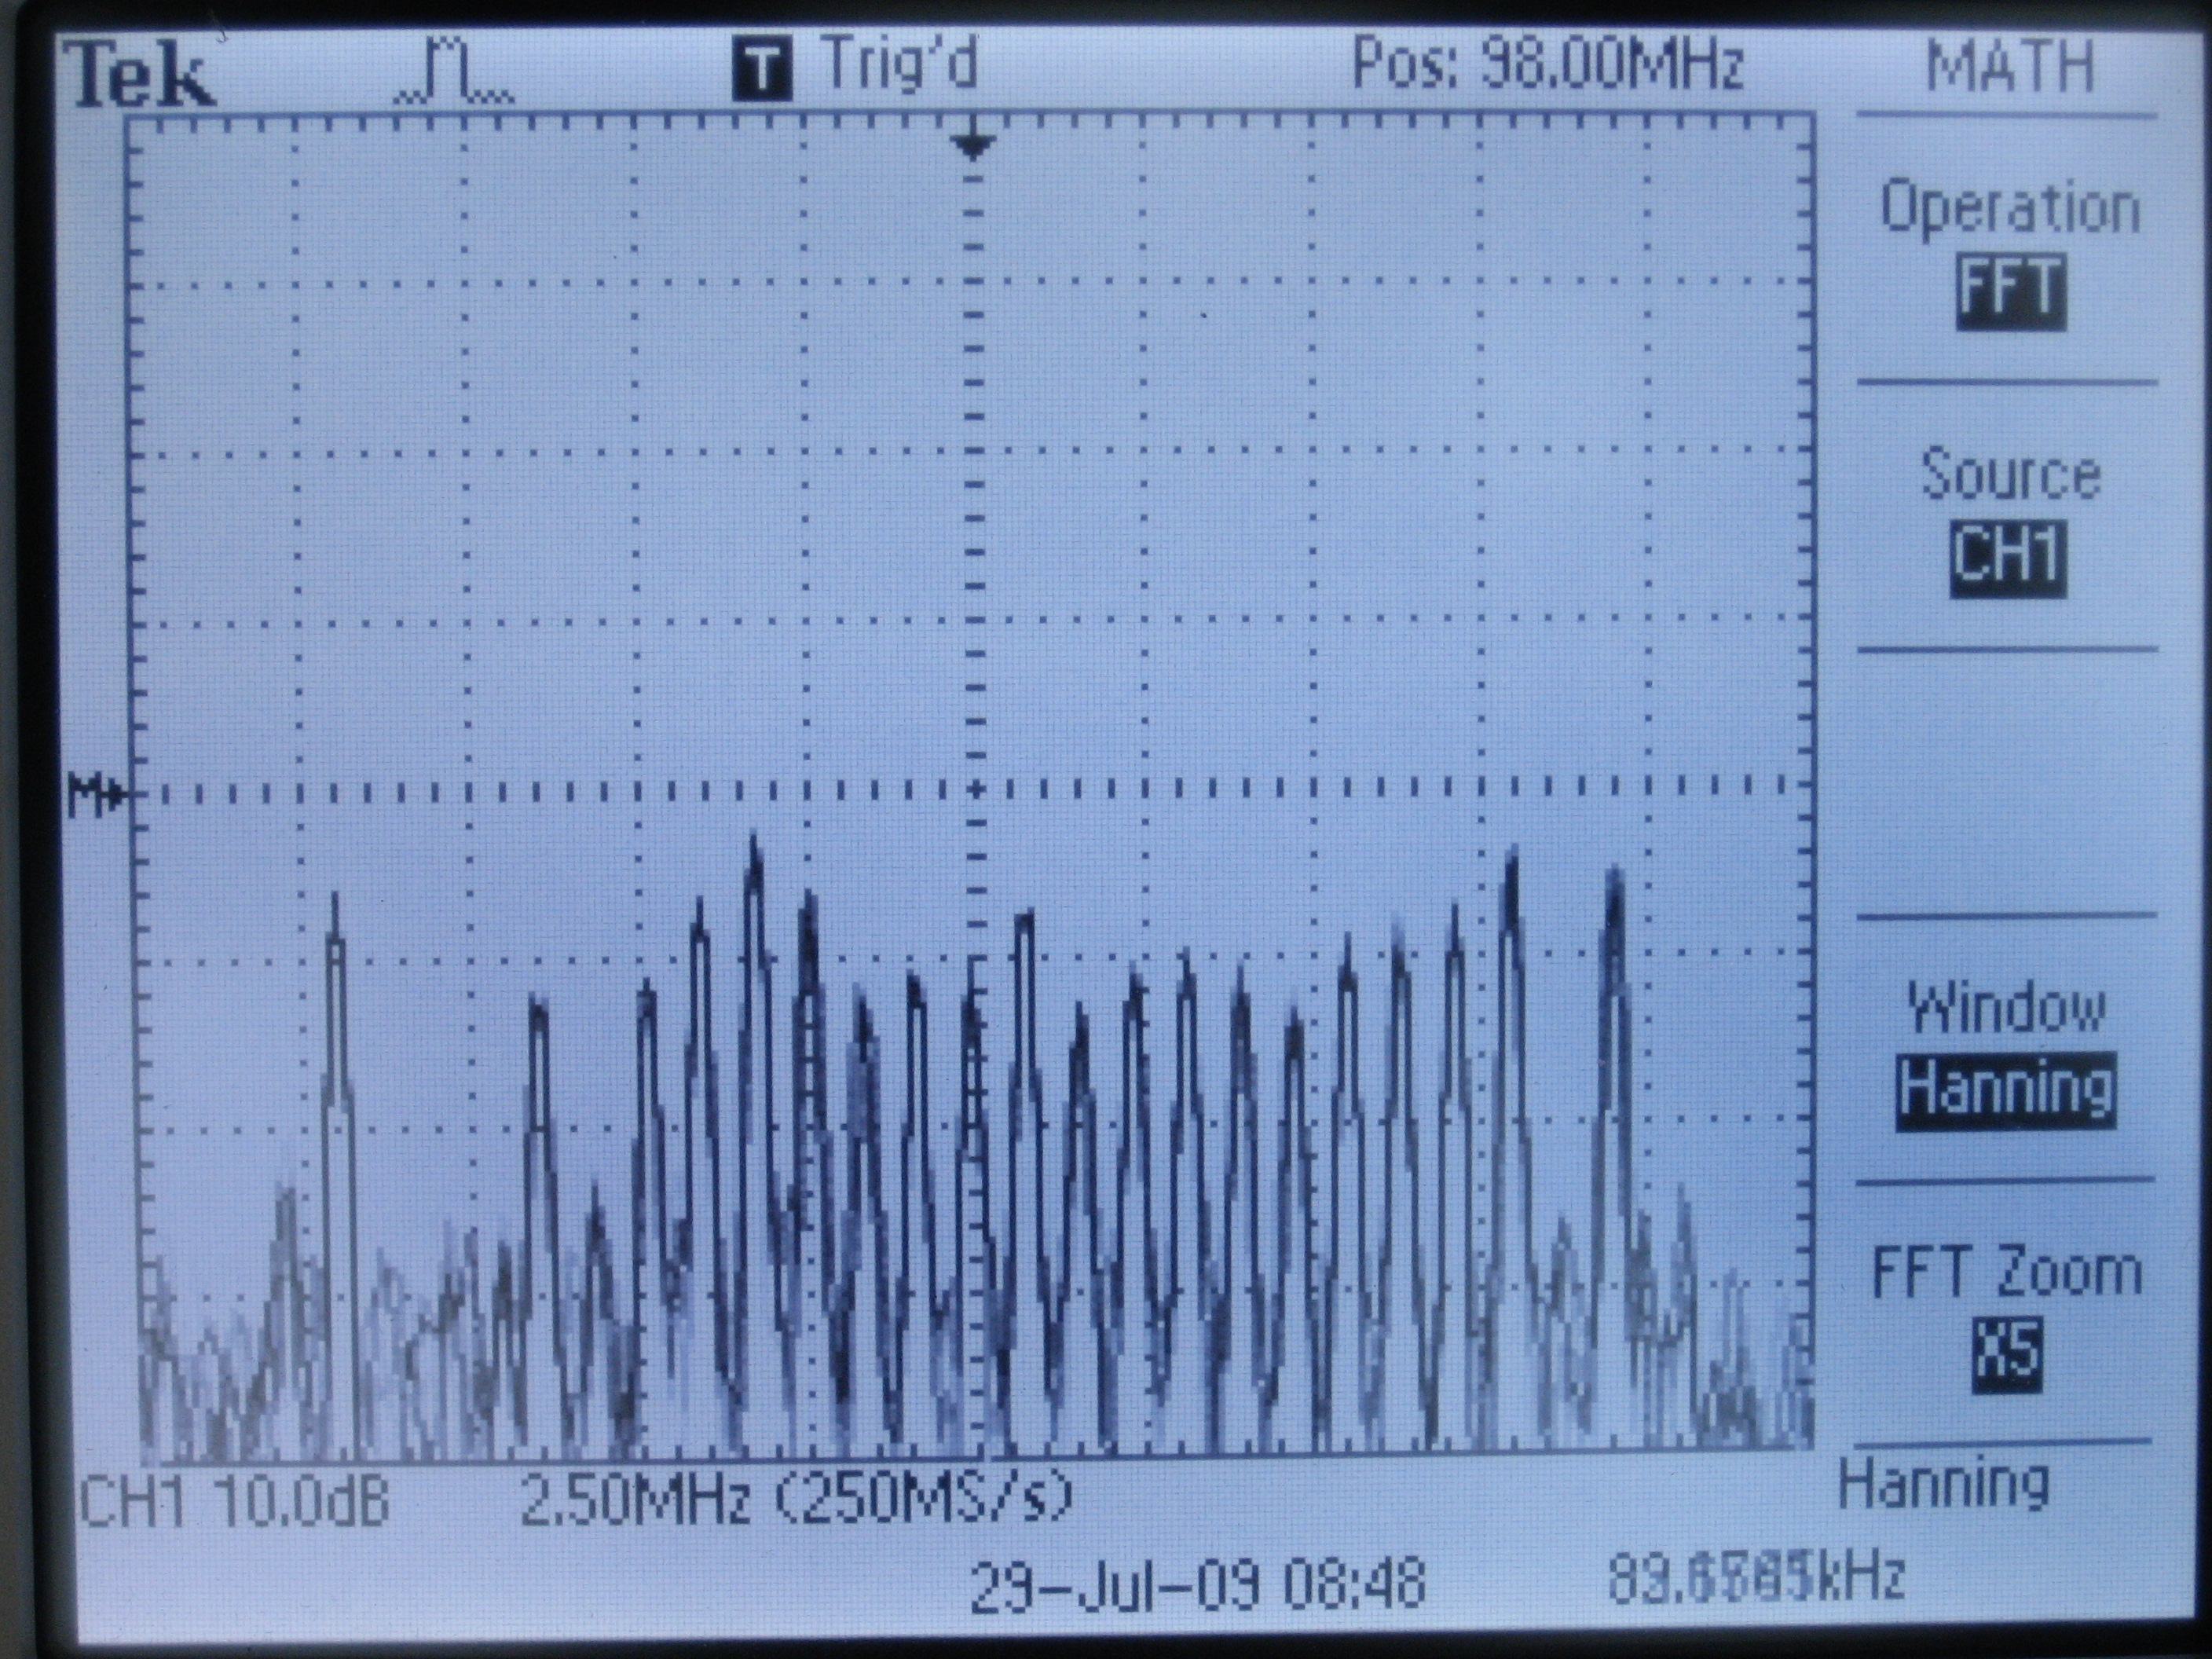
 An overview of the Chicago radio spectrum
The key things to note here are intensity is the vertical, frequency is the horizontal. Near the upper right corner is "POS:", which notes the frequency at the center of the display. At the center bottom is the horizontal scale, in this case 25MHz per big division. So the bump of stuff to the left of center in this image is at about 125MHz-25MHz= 100MHz, which is in the FM Radio band.
 FM Radio band.
In the FM band, you can see that there are plenty of stations filling the available channels. The isolated peak on the left is WHPK-FM, the campus radio station running at 100W, and is about two blocks from my location. It sits in the non-commercial section of the FM band.
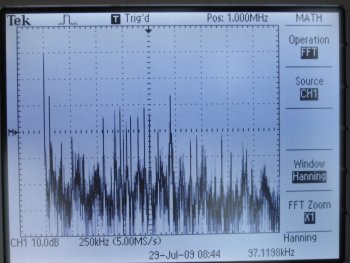 AM Radio band
The AM radio band at my location is dominated by WRTO-AM at 1200kHz. This station gets into any cable, any wire, and if you have any rectification from a piece of corrosion, or just input an antenna directly into a PC, you will get
La Tremenda.
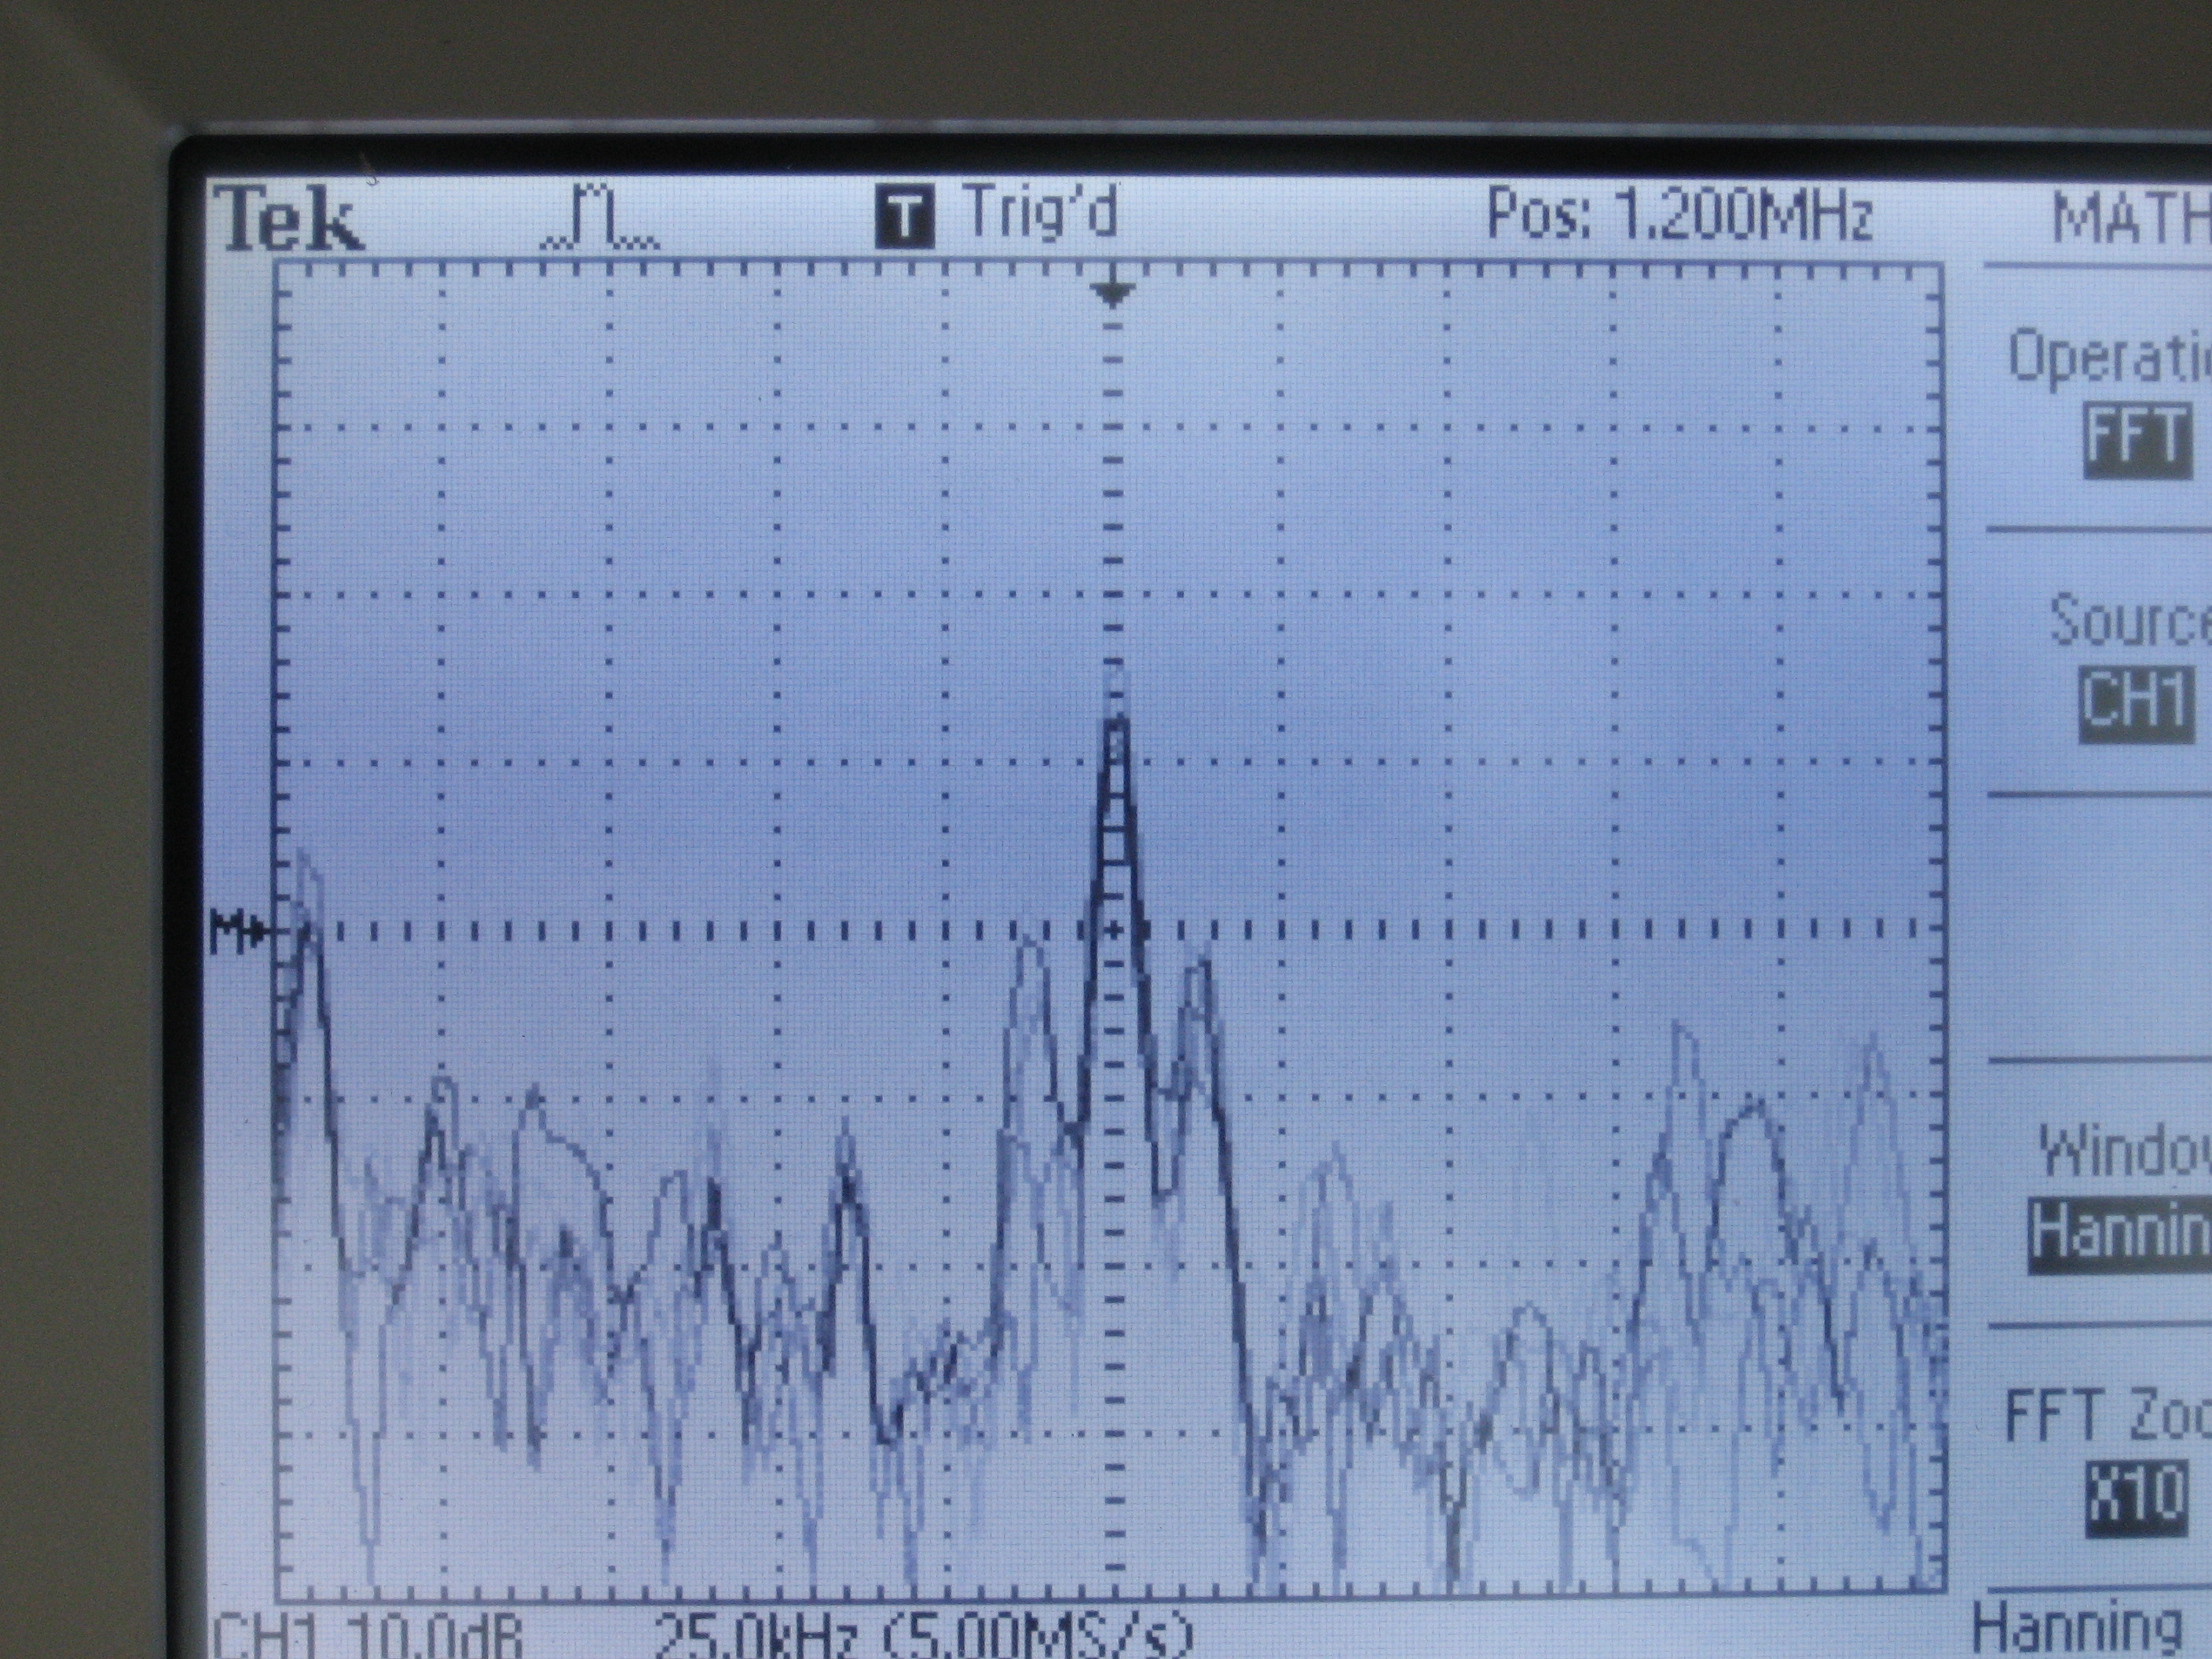
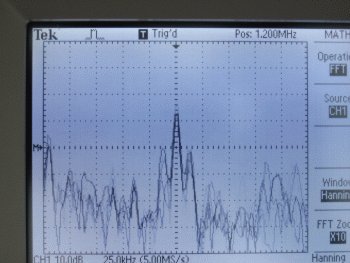 Looking closer at 1200kHz
If you look closer at WRTO's signal, you see it has a strong carrier and two sidebands further out at about 12.5kHz out. Now, when I originally saved this image, I thought I was seeing the audio sidebands of the AM signal. If the AM radio station broadcasts a single note at 440Hz, for instance, you'd see the strong carrier, and two line peaks on either side at 440Hz away. But here they are all the way out at 12.5kHz, a frequency that is present in "ssss" or a cymbal but little else. And especially not normal AM radio broadcasting, which is limited by the FCC to just a tad over 20kHz bandwidth, so the stations have to drop all their treble sounds.
It appears these outliers are the dreaded "HD radio", a hybrid technique that transmits the audio in two sidebands that exceed the normal width of an AM broadcast. Unfortunately this process violates old technical standards that allowed stations to coexist with each other. It was dropped in favor of a proprietary digital standard that allows big stations to use more bandwidth and clog up the airwaves with digital hash noise.
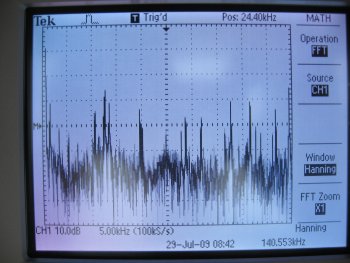
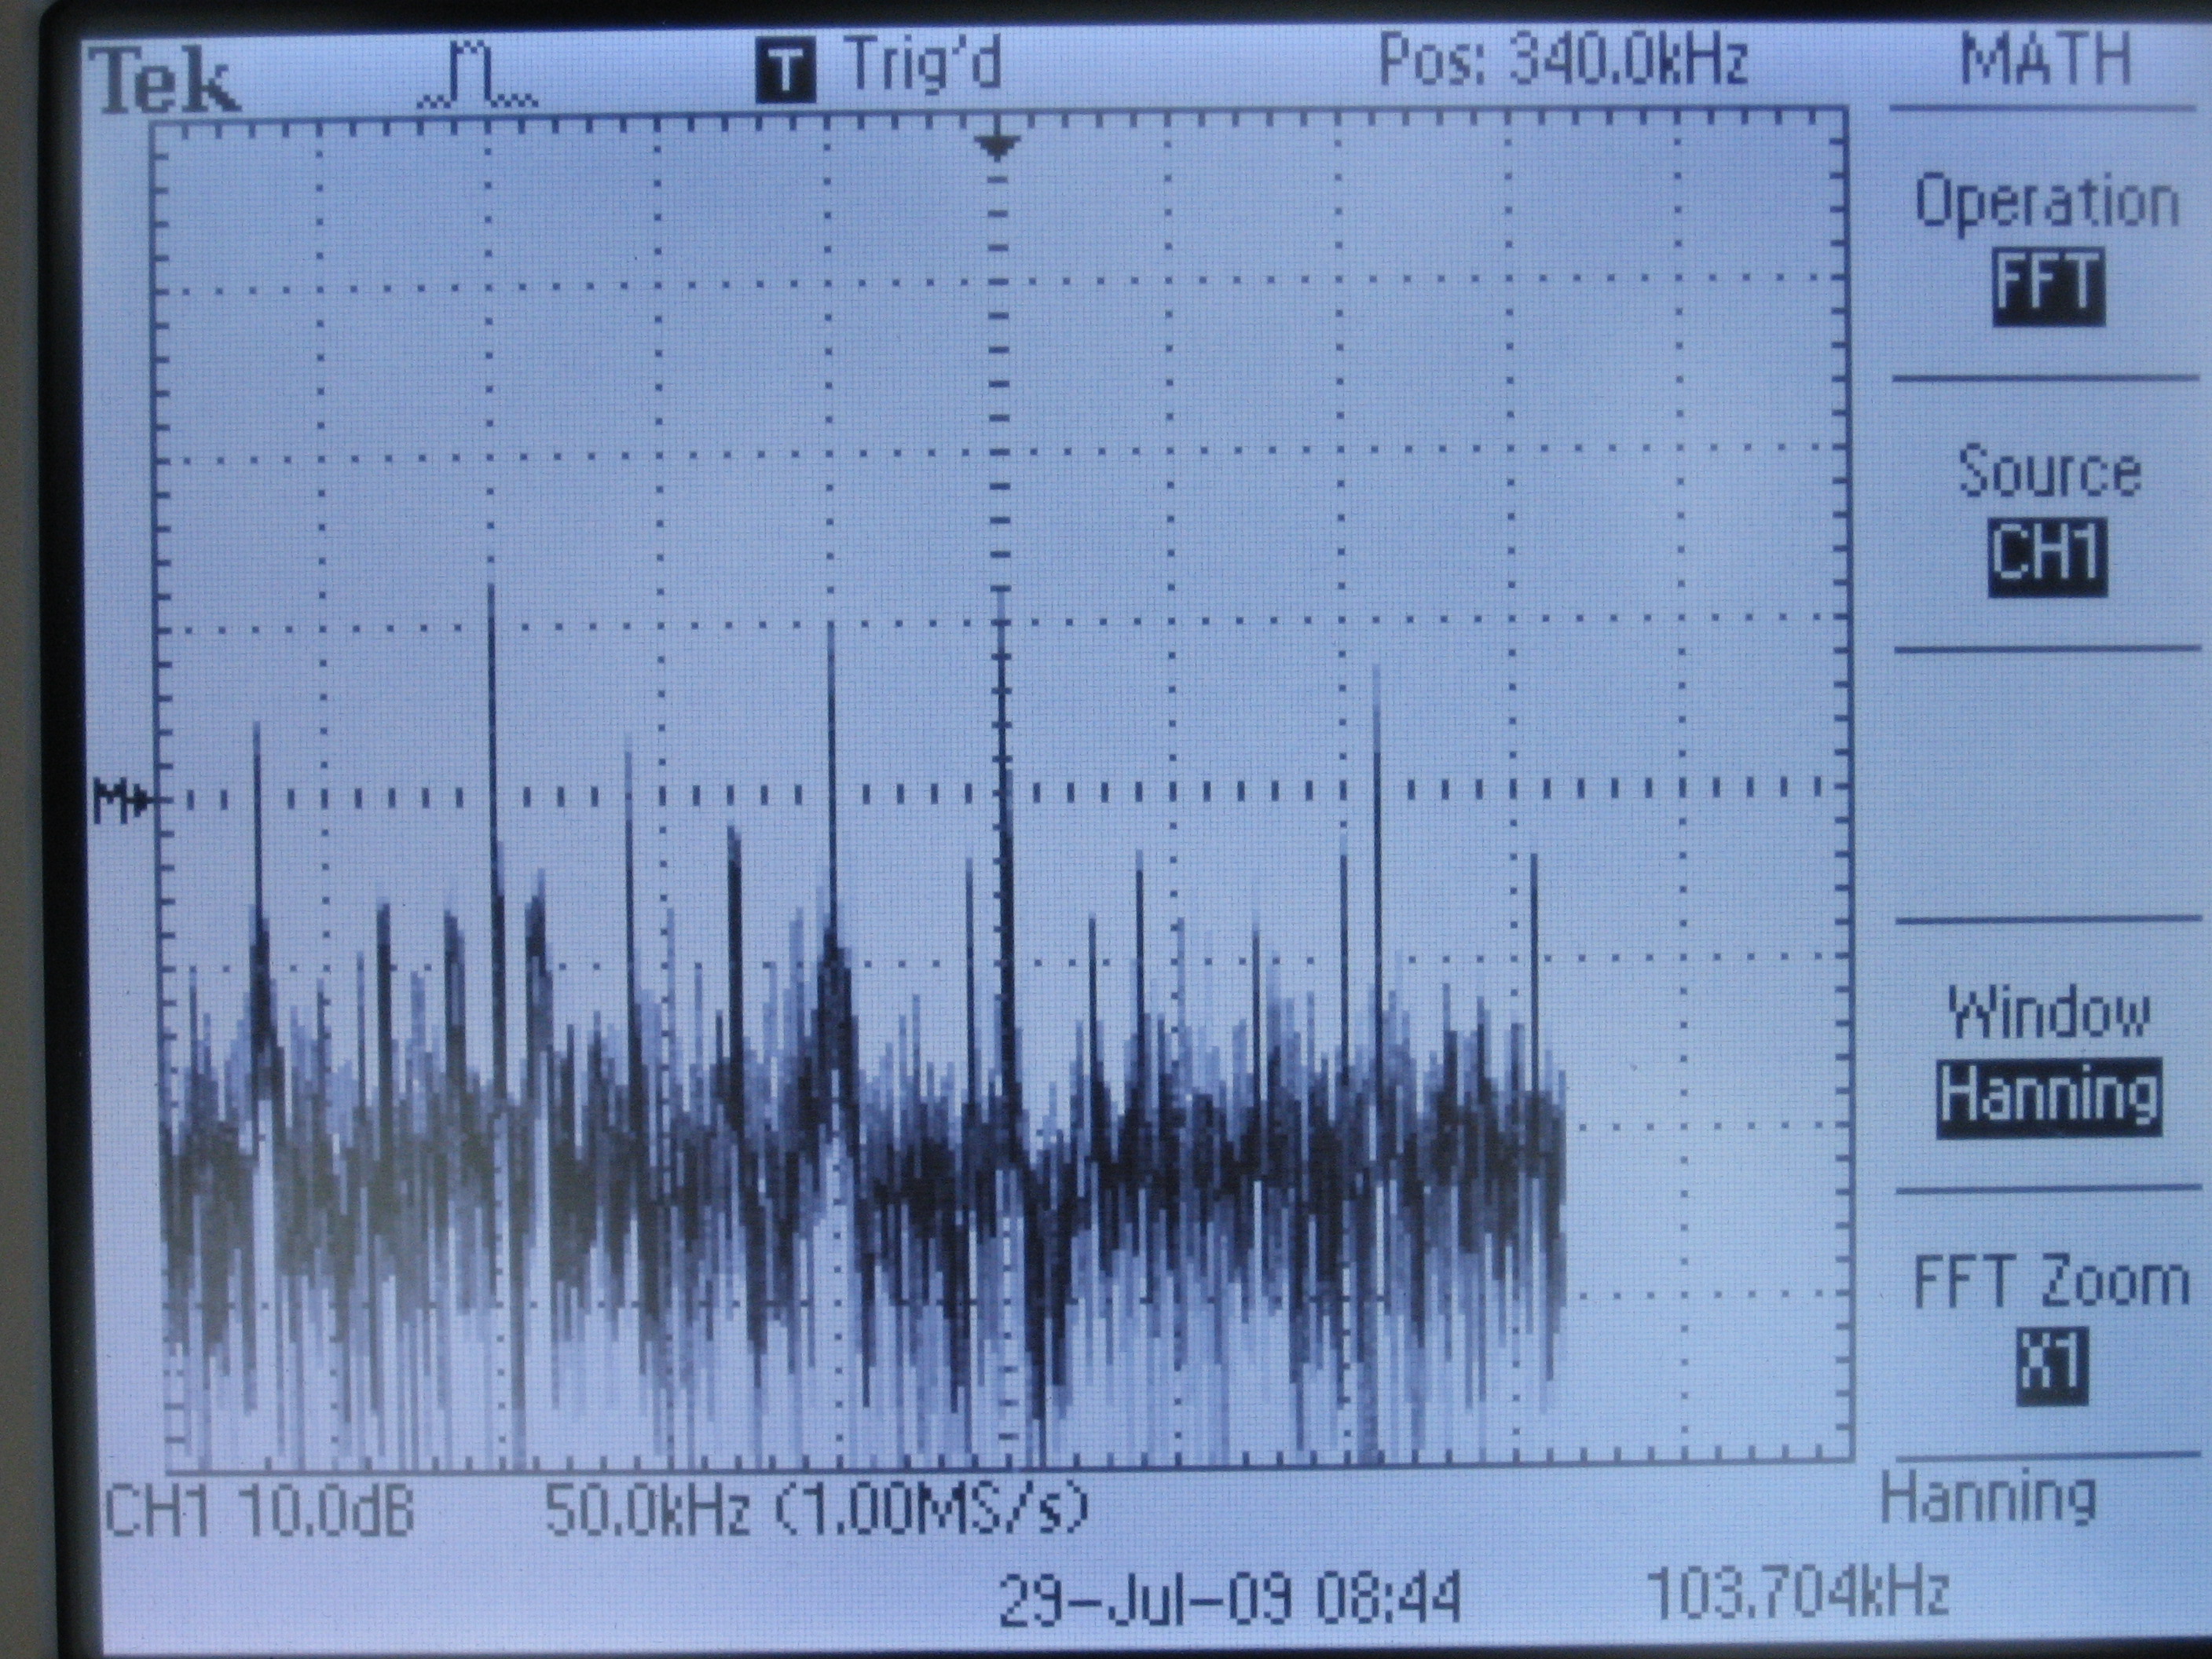
 Below the AM radio band
Just below the AM band is the rest of what is known as Mediumwave or Medium Frequency, which then transitions into LW or longwave; this band is notable for non-directional beacons for aeronavigation, DGPS (or differential GPS), and lots of noise. I will have to take another spin around this band to listen to some of those peaks and see if they are real signals.
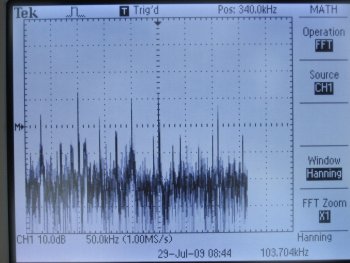
 VLF Radio spectrum
Once
you get down here, you start running into lots and lots of switching mode power supply noise.
Various Navies around the world still broadcast on this frequency for radionavigation and uninterruptible worldwide coverage. Two of the stronger signals to the left are probably the Russian radionavigation system at 11.9kHz and 12.6kHz.
I have some other snapshots showing excellent response to the shortwave radio broadcasters of the world. It's amazing to see the whole shortwave spectrum at once instead of moving around frequencies one kilohertz at a time.
 .
. 


