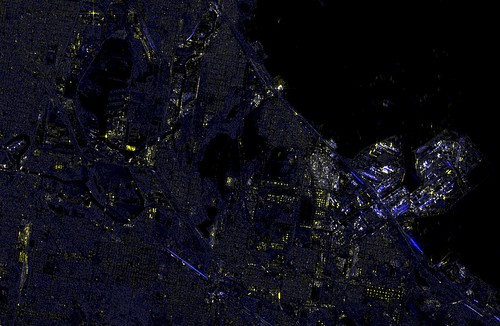
We have enterprise access to the Claude AI model world, and I'm experimenting with both the Claude code features and Chat/Co-work options. I thought something interesting would be a comparison of the city light pollution before and then a few days after the large derecho/tornado event that still has 100,000 people without power a week after the storm.
spots that were less bright on the 13th compared to the previous image. Ignore the broad fainter red marks -- this is because the previous image had plenty of moonlight.
I had thought about posting the entire conversation, as interacting with LLMs have some interesting failure modes, but not for today.
Tuesday, August 18, 2026
Tuesday, May 16, 2023
Geiger counter back up in Regenstein Library
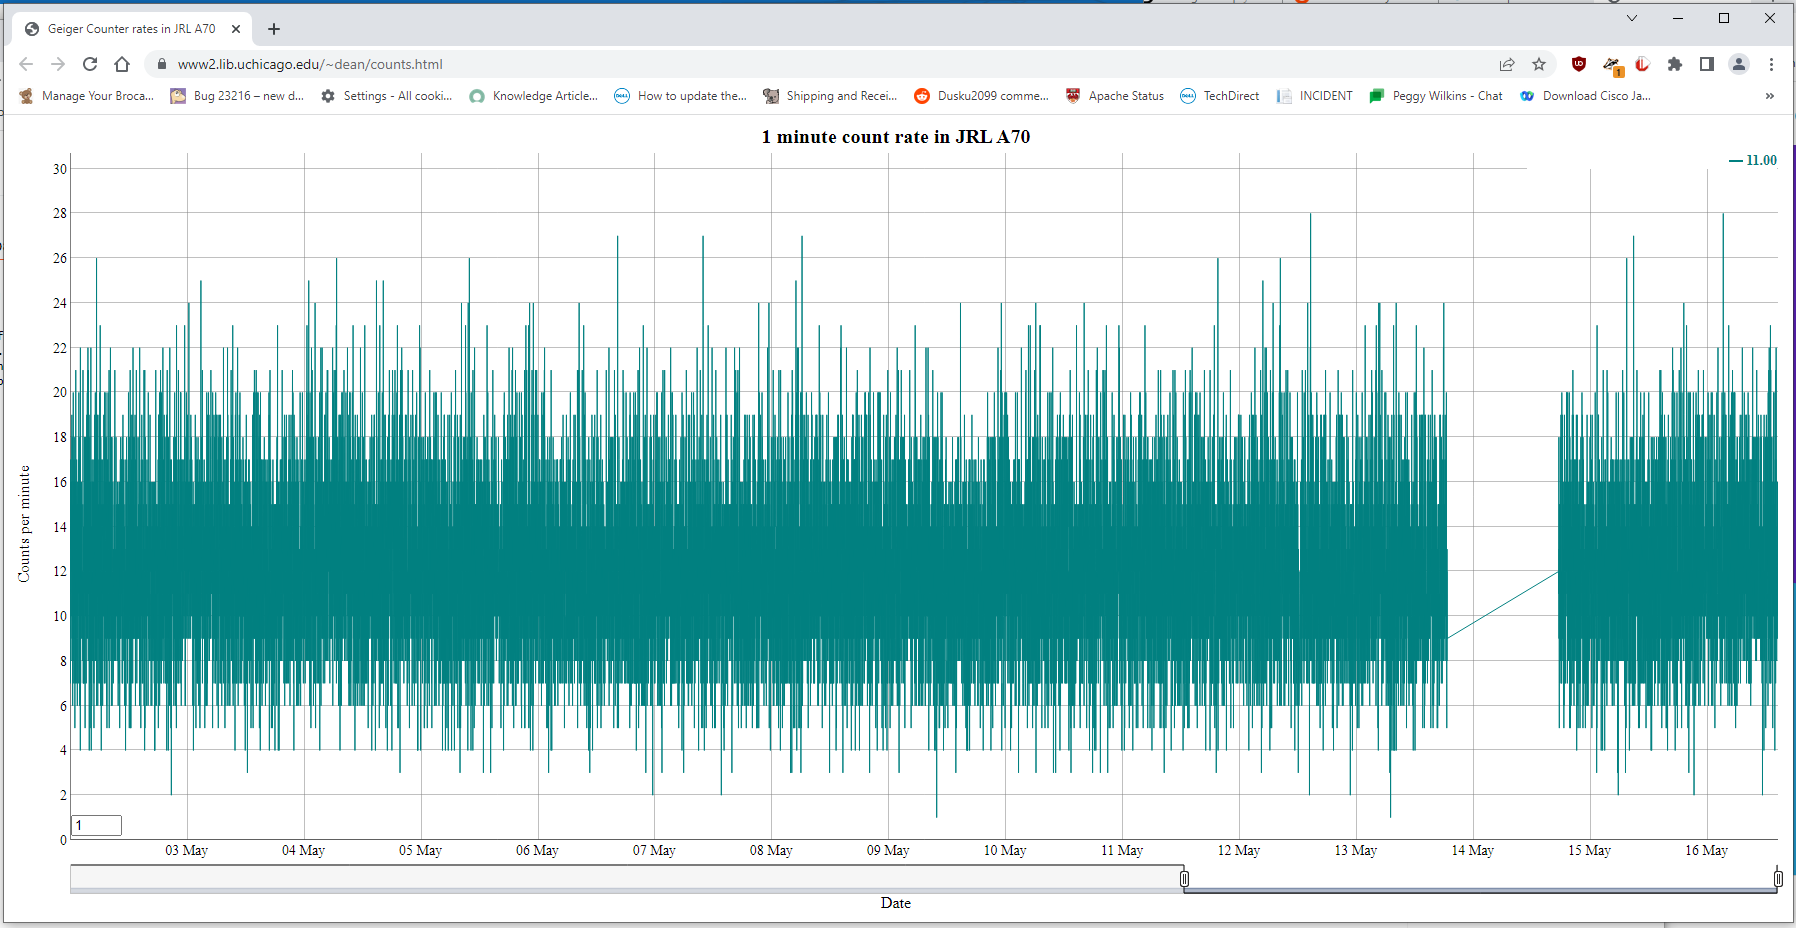
My long suffering Geiger Counter is back up and running. I used ChatGPT to create a sample Arduino sketch to interact with the pulses coming from the counter and send a per-minute count to the serial port. Then I have a Powershell script write the date-time and the number of counts to a CSV file on a web server. Then I have dygraph.js make a picture of the results. One flaw that is evident is if the Geiger counter connection gets loose, and it does, once it reconnects it looks like there's a sudden surge of rate, which is fake. Also, this whole thing is reliant on powershell running on a Windows box that gets patched frequently. Oh and ChatGPT will make very big mistakes that you absolutely have to catch.
Enjoy this subpar code!
Powershell:
const int geigerPin = 2; // the pin number connected to the Geiger counter output
volatile int count = 0; // variable to count the number of pulses
void setup() {
// put your setup code here, to run once:
pinMode(geigerPin, INPUT); // set Geiger counter pin as input
Serial.begin(9600); // initialize serial communication
attachInterrupt(digitalPinToInterrupt(geigerPin), pulseCount, FALLING); // interrupt on falling edge of Geiger counter pulse
pinMode(13, OUTPUT);
pinMode(5, OUTPUT);
}
void loop() {
// put your main code here, to run repeatedly:
delay(60000); // wait for 1 minute
detachInterrupt(digitalPinToInterrupt(geigerPin)); // disable interrupt
float cpm = count; // * 60.0 / 60000.0; // calculate counts per minute -- this seems wrong
// Serial.print(cpm); // print counts per minute //
Serial.println(cpm); // print counts per minute
count = 0; // reset count
attachInterrupt(digitalPinToInterrupt(geigerPin), pulseCount, FALLING); // re-enable interrupt
}
void pulseCount() {
count++; // increment pulse count
digitalWrite(13, HIGH);
tone(5, 3800, 5);
delay(50);
digitalWrite(13, LOW);
}
Powershell:
# Configure serial port settings
$port = new-Object System.IO.Ports.SerialPort COM3,9600,None,8,one
# Loop indefinitely
while ($true) {
# Read integer from serial port
$port = new-Object System.IO.Ports.SerialPort COM3,9600,None,8,one
$port.Open()
$number = $port.ReadLine()
# Write number to file
$path = "\\samba\dean\web\counts.csv"
$timestamp=get-date -format s
# // $NewLine = "{0},{1}" -f $date,$number
# Format the data as a CSV string
$data = "{0},{1}" -f $timestamp , $number.Trim()
#// $NewLine | add-content -path $file
# $string=$date,$number
# //Add-Content $path $string
# Append the data to the file
Add-Content $path $data
echo $data
$port.Close()
}
Sunday, October 23, 2022
Grabbing a NOAA weather satellite download
NOAA has a set of older LEO weather satellites that send an analog signal of the the sensor data they receive, one line at a time, and these are easily listenable with modest equipment.
I picked up this image from NOAA 18 this morning, just by chance (I had just come in from listening to the ISS repeater and happened to leave the SDR listening on 137MHz).
Recording via SDRSharp, WFM modulation, 35kHz bandwidth, gain at 30-40dB with a short vertical monopole indoors. Decoded with the appropriately named https://noaa-apt.mbernardi.com.ar/
Saturday, July 24, 2021
Compact Fluorescent Lifetime report #4
As previously mentioned, I've tried to keep track of CFL bulbs I used and how long they have lasted. Some have outlived some of the newer LED lights I now buy, which is related to the reduction of manufacturing cost by the makers of them. My early LEDs are still running from 2011, including the famous L-prize bulb won by Philips, in a torchiere conversion I did a long time ago and still use.
This bulb was used for a several hours each day from 2008-2011, pretty much not used for two years, then was used for a short time daily and at most an hour or two weekly from 2013-2021 in the laundry room in a horizontal position. So, it probably lasted about 5000 hours. The bulb warranty was set as "guaranteed for 5 years at 4 hours each day" and labeled as 8000hrs.
Thursday, April 01, 2021
Wednesday, December 16, 2020
Finding your USPS postal carrier route
If you are like me, you like to know how things are organized. What is my postal carrier's route? How many houses and businesses do they have on it? If someone else says they aren't receiving their mail, is that on my carrier's route as well?
Searching for this info should seem simple, but Google guides you towards paid solutions like Melissa -- just like when searching for a weather forecast they'll send you to a commerical provider instead of the NWS.
The USPS offers a service called "Every Door Direct Mail". You can deliver to them a stack of advertising mailers and they can deliver them cheaply to individual carrier routes. And so the information about the route is available.
Just visit https://eddm.usps.com/eddm/customer/routeSearch.action and enter your ZIP code
. Carrier routes with demographics, incomes, numbers of business & residents are then clickable on the map. Enjoy!Tuesday, February 18, 2020
1st Starlink sightings
I just caught the end tail of a pass of Starlink satellites. I haven't really tried to see them, but it was clear tonight and we had a convenient pass of a constellation of them. They were all from the Nov 11th 2019 launch and were brighter than predicted (3.0)--looked like about Mag 2 to me--but I wasn't checking very hard. Something like 5 in a row--had I started watching earlier would have seen 12. The chain I saw started with Starlink-1051, then 1012, 1026, 1013, 1009, and finished with 1015.
Tuesday, June 25, 2019
Meteorite detected in NEO survey before impacting in Caribbean
https://remanzacco.blogspot.com/2019/06/small-asteroid-neocp-a10eom1-impacted.html?m=1
Debris trail in atmosphere seen in weather satellite imaging
about 3m diameter from rough infrasound measurement.
H=29.3 from optical measurement would imply about a 4m diameter.
Wednesday, February 20, 2019
The problem with the uranium at the Grand Canyon story
There's a hot story right now about three buckets of uranium ore that was stored at a museum at the Grand Canyon, with a claim of it being quite radioactive and a particular employee claiming the whole thing was covered up.
The problem is the employee's numbers are off by a factor of 1,000. The presentation slide has the outside background rate at 2 mRem/hr. That's gotta be wrong; an average exposure in the Colorado Plateau is about 90 mRem per year, which would be something like 0.01mRem/hr aka 10 uR/hr. The buckets at the surface were really more like 300uRem/hr, or 3mRem/hr.
Saturday, February 09, 2019
Image received from the International Space Station
I received an image that was being transmitted from the International Space Station as it passed nearly overhead this evening. They broadcast at about 25W of power at 145.800 MHz; an amount that is easily heard and received since the communication is line-of-sight and only a few hundred miles away. They only use it on occasion so it was nice to hear they were planning on a few days of sending images. I used a generic SDR receiver and a simple dipole and piped the audio output to MMSSTV. Some of the noise in the center of the image was because I forgot to correct the receiver for the Doppler shift of the ISS as it passed by.
Tuesday, November 20, 2018
CFL lifetime report #3
As seen previously, a series of CFLs I used starting around 2008 onwards failed at varying lifetimes. I report a third failure, of a Nvision 14W installed in June of 2011. It failed in May of 2018. That's just about 7 years of roughly 3-4 hrs of use daily. The lifetime estimate ranges around 8000 hours for that one.
Thursday, September 13, 2018
Visualizing a "How low can you hear?" test
A facebook link a friend shared mentioned a sound test and wondered if it was accurately matched to the listed frequency. I ran the sound through Spectrum Laboratory and then tried out making a desktop video with Open Broadcast Studio.
Monday, August 27, 2018
Burning Man in Synthetic Aperture Radar
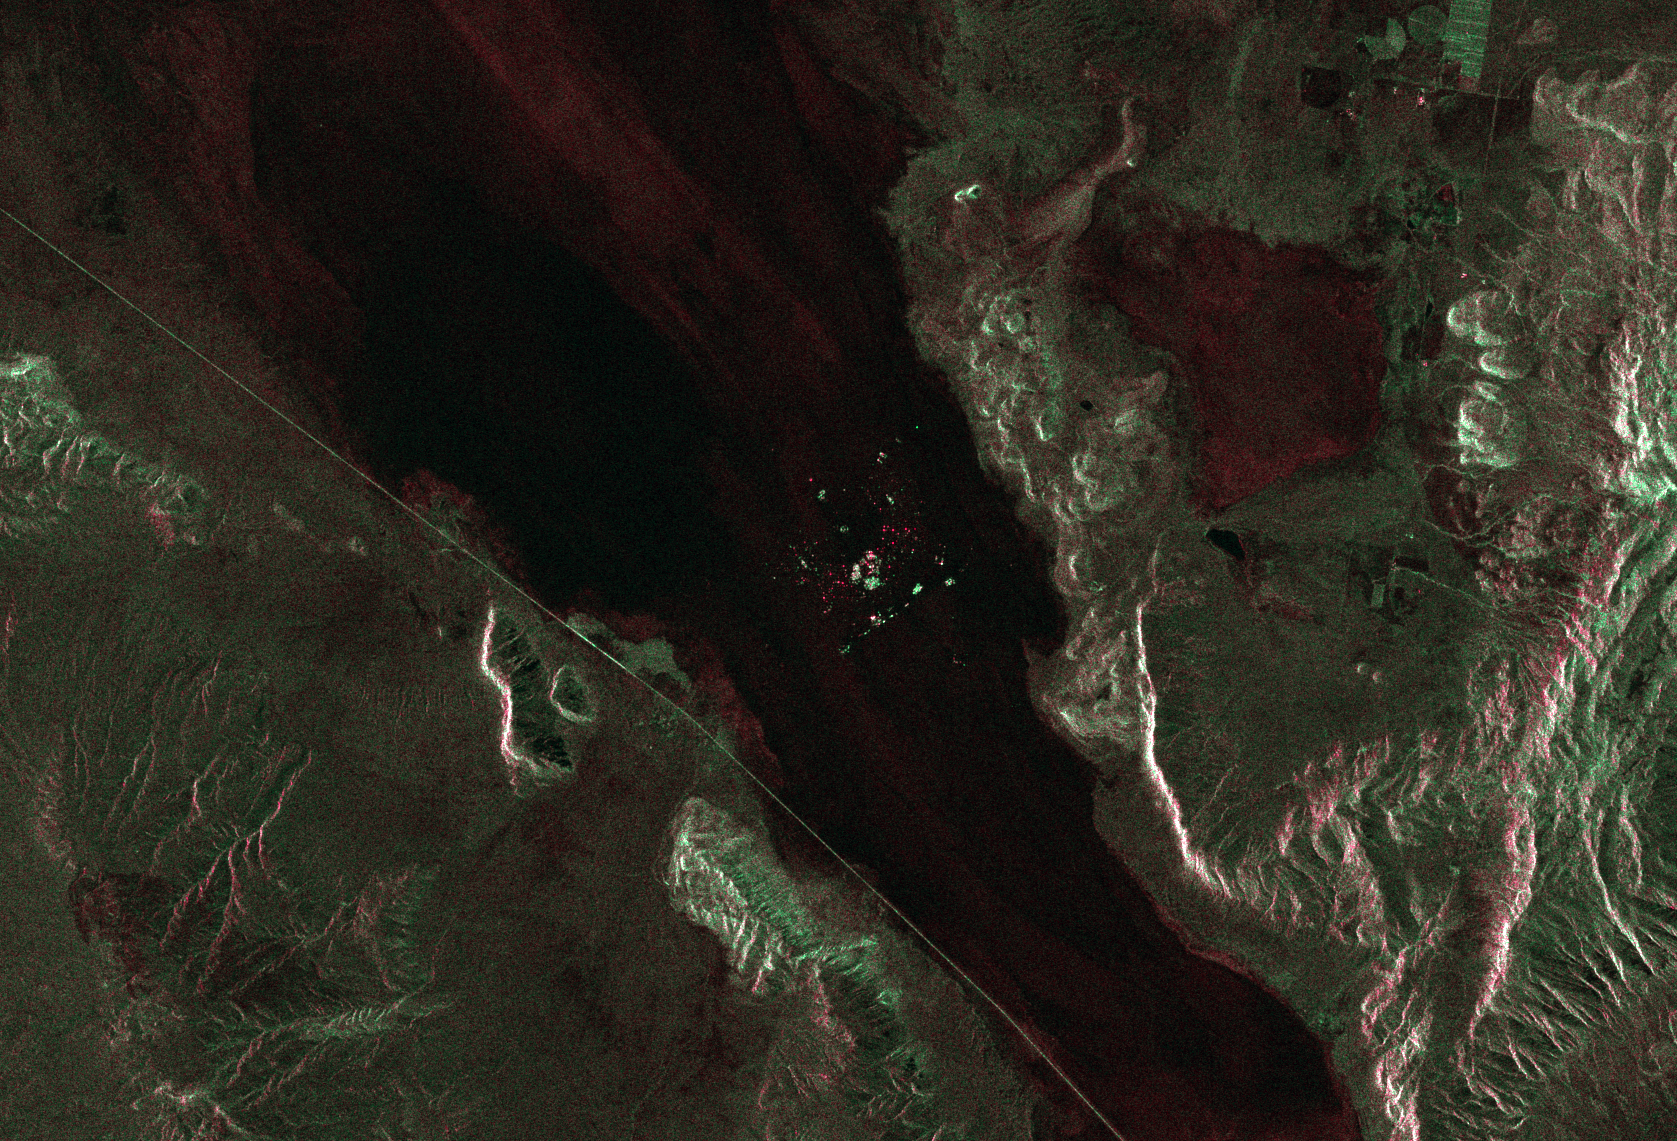
I downloaded the Sentinel-1 Synthetic Aperture Radar data of the Black Rock area taken on August 19, and the start of Burning Man work is apparent. The colors represent different polarizations of the returns. This is a very small subset of the original 25000x16000 pixel image.
Also found this one from the 24th (horizontally flipped to correct)
Friday, July 13, 2018
Freighter visible on weather radar
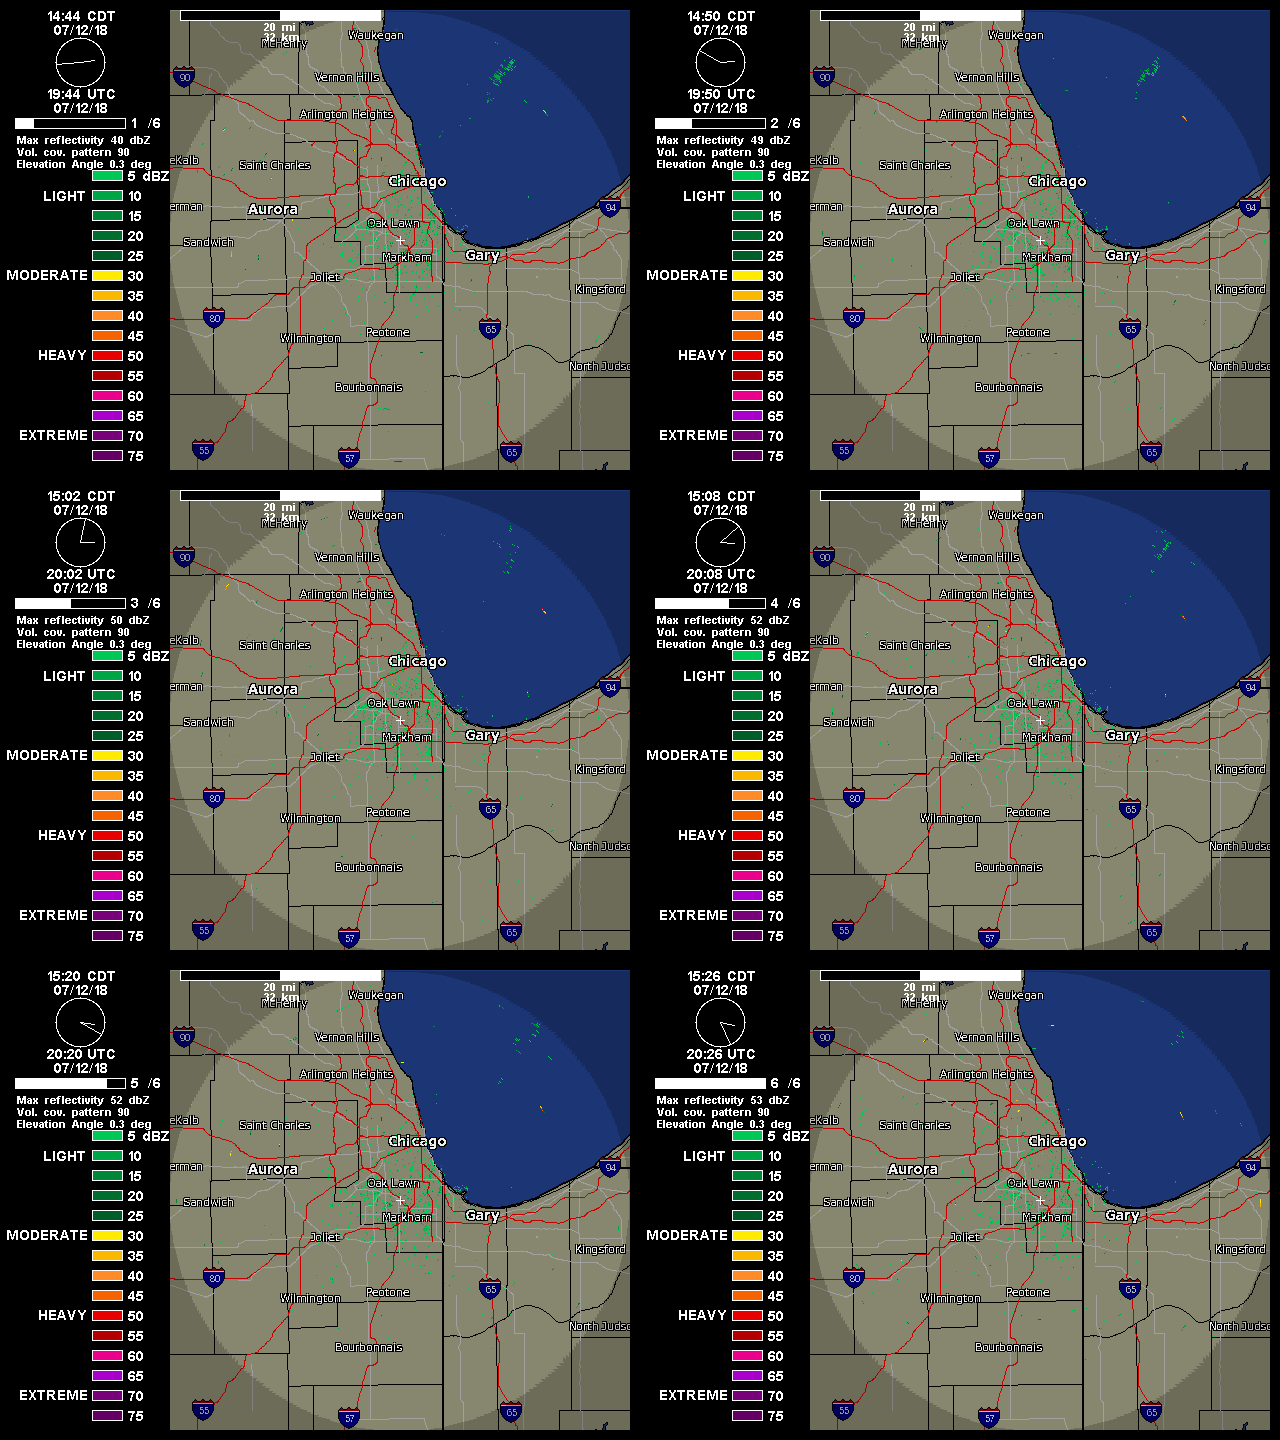
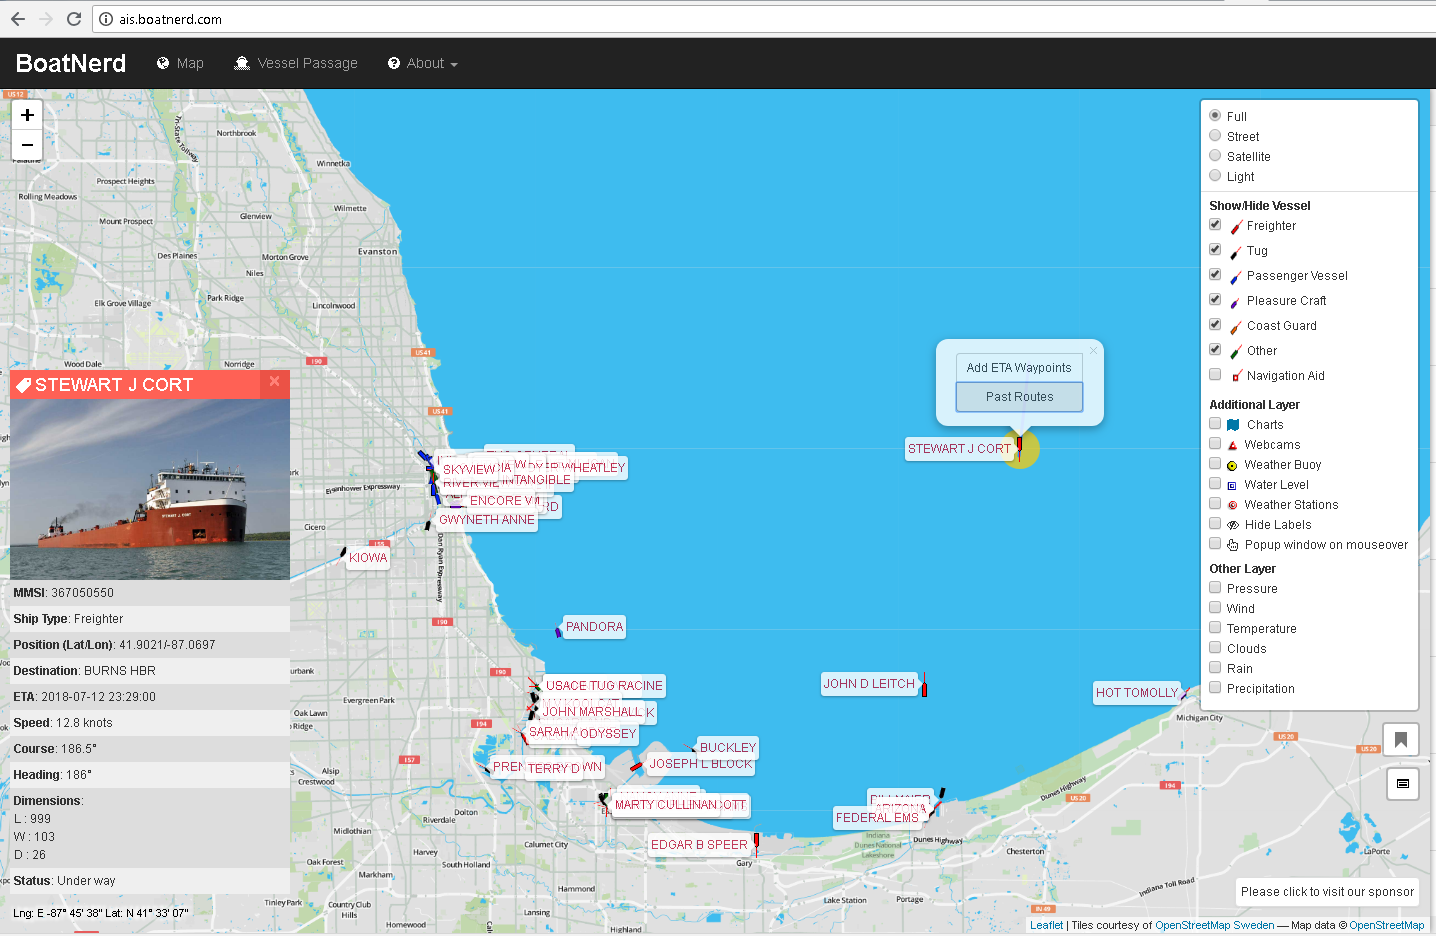
The Terminal Doppler Weather Radar system for Midway Airport caught the freighter Stewart J. Cort traveling on Lake Michigan towards Burns Harbor, IN. It's the return out in the middle of the lake heading south. I ID'd the ship with AIS Boatnerd
Sunday, August 13, 2017
AM Broadcast Band, day vs. night
This is a comparison of the broadcast band during the day (at top) vs at night (bottom). Many stations are required to lower their power and/or change their antenna directionality at night because the absorptive D region of the ionosphere disappears and allow lower frequency waves to propagate via a skywave. Some stations, called clear channels, are allowed to maintain their high power at night. Chicago happens to have quite a number of them-- you can see them at 670, 720, 780, 890 and 1000kHz. Local stations including the clear-channels are marked (minus 1690). At night, you can see a carrier at nearly every 10kHz, showing many of the AM stations listenable at night from across the US. WSCR 670 and WBBM 780 are unfortunately also using HD Radio.
Local switching power supply noise appears as very impulsive (fast horizontal bands) at about 615, 925, 975, 1090, 1230, 1500, 1550 and 1850kHz. The fundamental for some of these appears to be at 306Khz. You can see in the IF this signal, as well as the much weaker DGPS signal at 304kHz from Mequon,WI.
This was taken with a simple indoor dipole of 42ft length (with some turns in it) and a RTL-SDR.com v 1.3 dongle with HF direct sampling (Q-branch) and AGC turned on.
Thursday, August 10, 2017
The radio satellite CUTE
The nanosat CUTE, or rather the CUTE-1.7 + APD II, sends out a beacon in morse code. I picked it up with a simple antenna and a SDR. Time increases to the right in the image and frequency is the vertical axis. It shifts because the satellite was moving away from me during the capture. Track CUTE for your location.
Wednesday, May 04, 2016
Revisiting the Lake Geneva SAR image
I realized my first processing of the Sentinel 1A radar image of Walworth County, WI, was deficient and I lost a lot of the details, so here's a much better grab of the HH channel.
Monday, May 02, 2016
SAR image of the Calumet region of Chicago
I've been working on manipulating the large images offered by the Sentinel satellite. I found an image of the city of Chicago region on April 10th, 2016, and have been taking a look at it. The data image is 25000x16000. I grabbed the HH(the Horizontal transmitted, horizontal received polarization) and HV images (horizontally transmitted, returned vertical polarization), normalized them and made them R and B in an RGB set. The G I created by adding the two images together. Adjusting the hue allows for greater visual impact of the image.
This is the Calumet region of southeast Chicago and Northwest Indiana, a heavily industrialized region. Lake Calumet, Lake Michigan, Wolf Lake, and the Calumet River/Cal Sag all show with no reflectivity at this normalization (you'll recall the previous post where Lake Geneva had some return from waves). The ArcelorMittal steelworks sits out on the right as a highly reflective region of pipes, stacks, rail cars and other industrialness, with the BP Whiting refinery to the left of it as another nearly continuous return. Long linear blue streaks are presumed oil or ethanol conveys consisting of mile-long packs of tanker cars that are bright in the HV channel. Shipping containers, barges, oil tanks and rail cars that are not tankers all reflect highly in the HH return. Even Binions Horseshoe floating casino shows up brightly. A bright return in the upper left I assume is the tower at Promet steel.
Wednesday, April 27, 2016
Synthetic Aperture Radar data of Lake Geneva, Wisconsin
I happened upon a nice description of how to grab data off of the ESA's Sentinel satellite via Evan Appelgate and there's a bunch of interesting things in the data. It was taken just this Tuesday morning at 7:11AM. The winds were out of the north at 8MPH and overcast. You can see in the image the effect of the wind creating a rougher, more radar scattering surface on Lake Geneva--dark at the north shore, transitioning to a very slightly rougher surface to the south.
Click to enlarge. There's a lot more interesting things to look at--that's just the first thing that jumped out at me.
Sunday, March 06, 2016
A really bad soldering iron
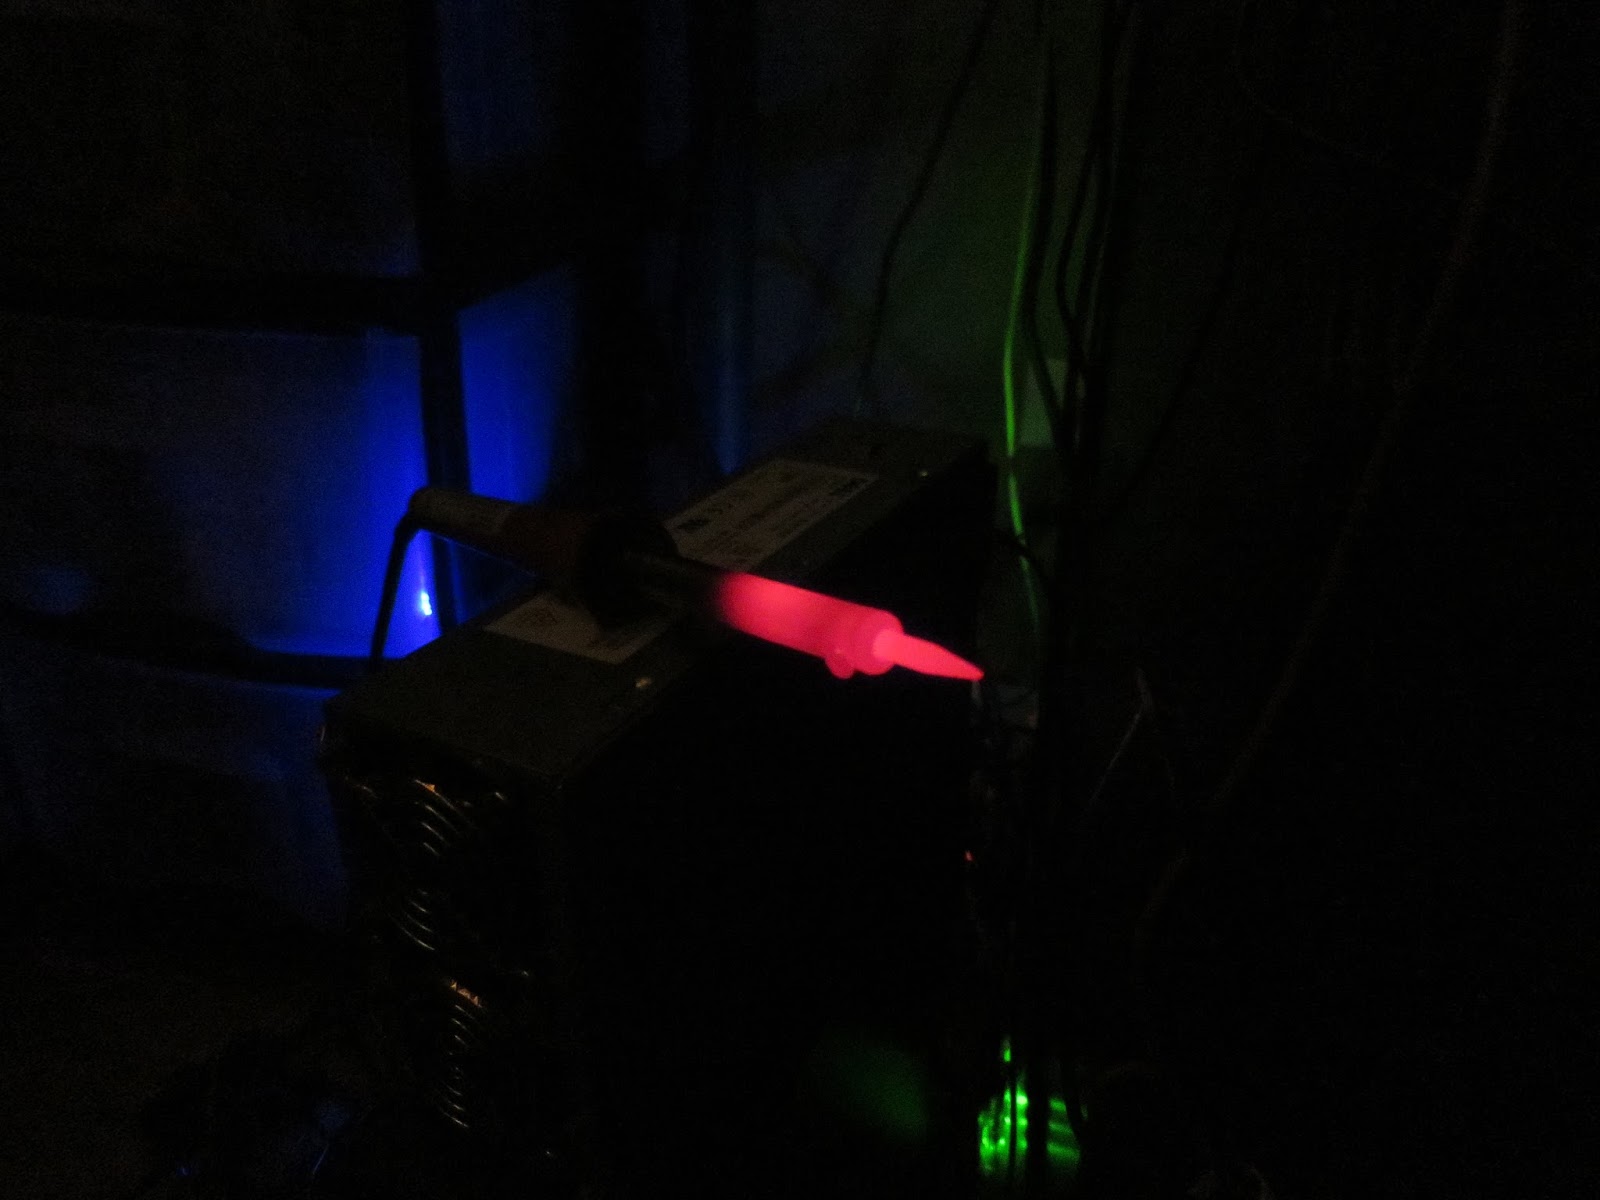
I picked this soldering iron out of the ewaste recycling stream that students dump at the end of the year, figuring I could use another iron. I knew it ran hot. Yesterday I was attempting to create a data cable between a PC and a radio and was annoyed at how quickly oxidized the tip had gotten. After cleaning it and trying again (failing ultimately because the PS/2 keyboard connector happens to not use one of the pins) I noticed a subtle warm color to it--and thinking it was just the orange light pollution reflecting off of it, but then I put two and two together and realized it was black body radiation. And that means this soldering iron is really really bad.
The camera appears to have a fairly good IR block filter on it, so the colors match better to the eye's response. On a weaker camera I would expect a purple appearance to it as the blue Bayer filter will pass IR circa 900nm.
Subscribe to:
Posts (Atom)