Monday, May 21, 2007
Update on geiger counter
I've been running the geiger counter nearly continuously for a year and a half--since December 1st, 2005. It's down today because we are going to build a cloud chamber at the Ryerson Astronomical Society meeting tonight, and I'd figure we'd have some other detectors there as well.

Sunday, May 20, 2007
Mercury, the Moon, and Venus
As I mentioned in my last post, more images from the evening of May 17th.
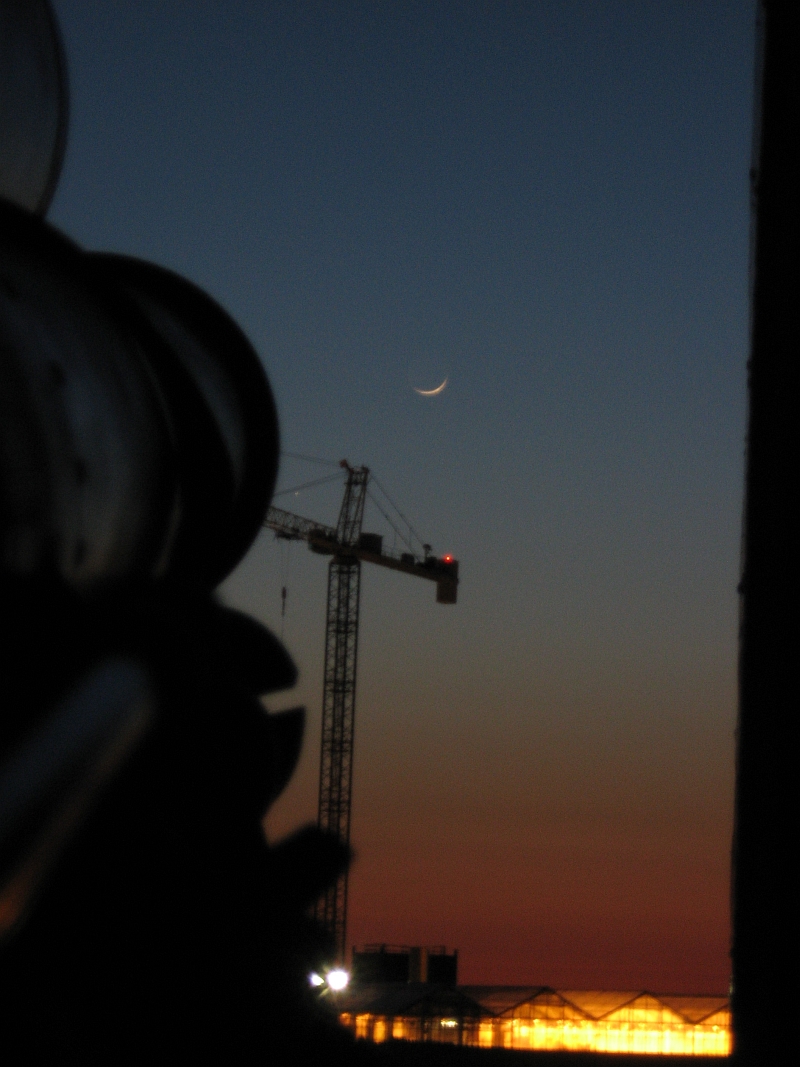
You can see the Moon--but look closely at the support wires on the left side of the crane--see Mercury?

Through the telescope, the autofocus picks up the high contrast of the crane--and makes Mercury a round blur.

Forcing the focus to Mercury.

Venus, much higher up in the sky, but still subject to atmospheric dispersion.

You can see the turbulence by viewing this video of Venus here (753kB, 0:17 WMV).
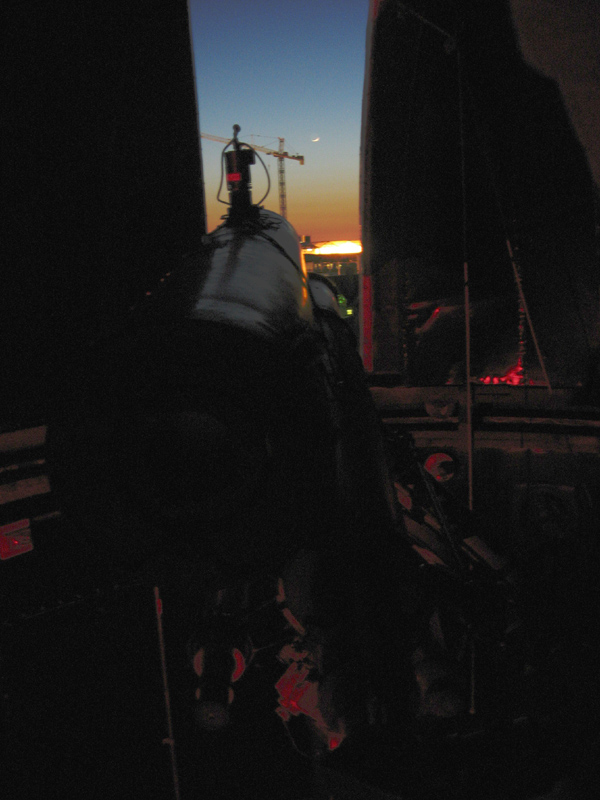
The wide view.

You can see the Moon--but look closely at the support wires on the left side of the crane--see Mercury?
Through the telescope, the autofocus picks up the high contrast of the crane--and makes Mercury a round blur.

Forcing the focus to Mercury.
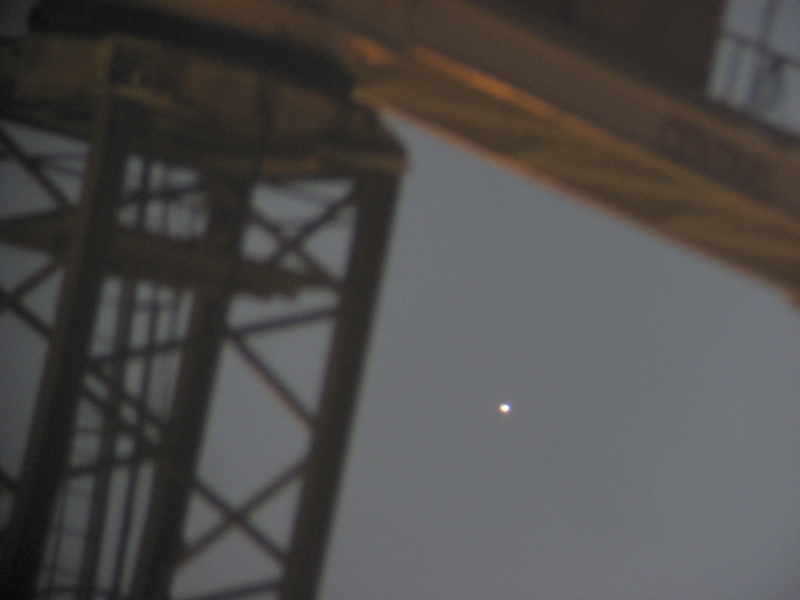
Venus, much higher up in the sky, but still subject to atmospheric dispersion.

You can see the turbulence by viewing this video of Venus here (753kB, 0:17 WMV).
The wide view.
Friday, May 18, 2007
The young moon
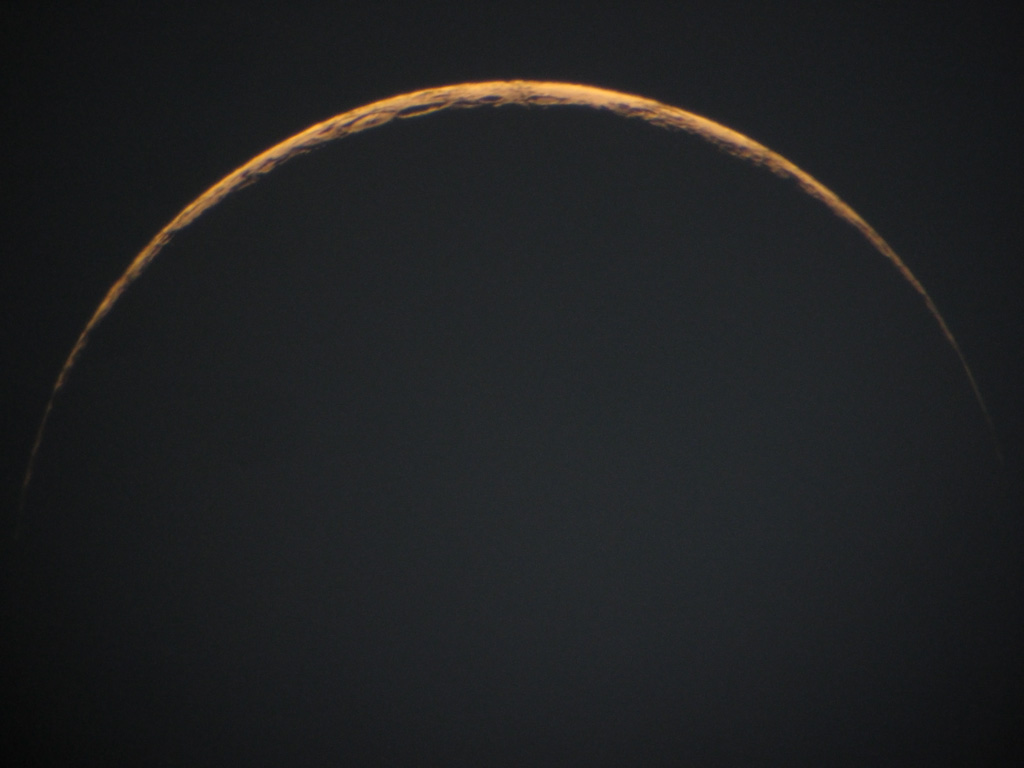
The 29 hour-old moon was beautiful last night, and just a few degrees away was a suprisingly bright Mercury.


Composite of two images.
Both were taken through the Ryerson 6-inch refractor and a Canon A540 camera. I have more images--will post them as soon as I finish processing them.
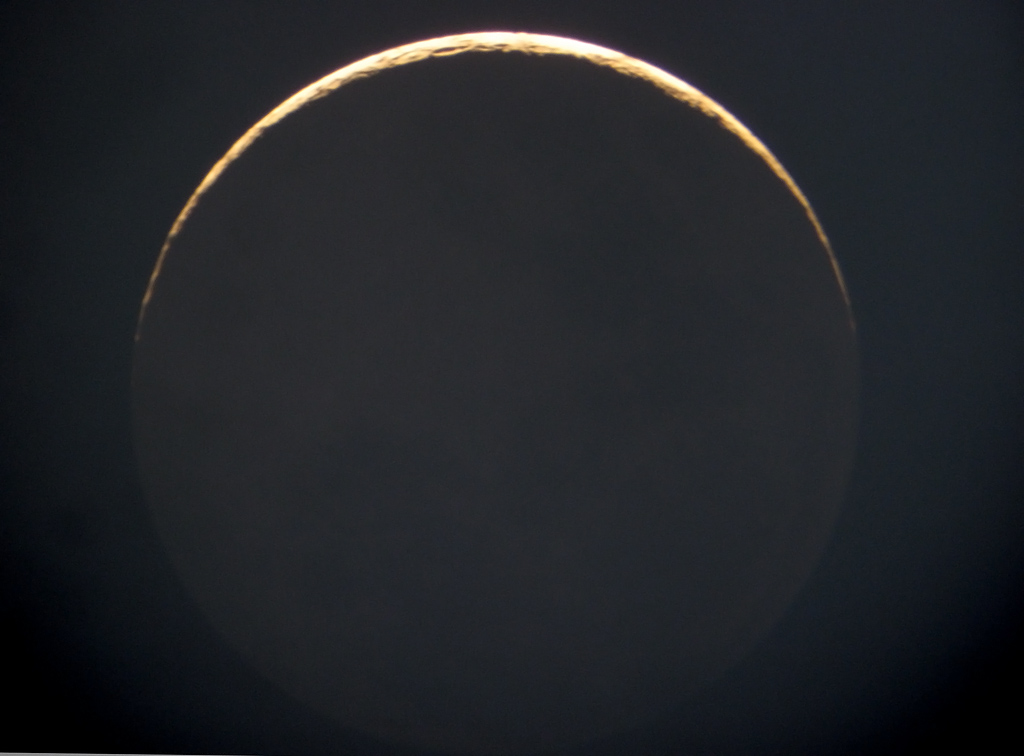
Composite of two images.
Both were taken through the Ryerson 6-inch refractor and a Canon A540 camera. I have more images--will post them as soon as I finish processing them.
Tuesday, May 15, 2007
Tvashtar erupting
Wow--New Horizons has created an animation of Tvashtar on Io erupting--it's gorgeous:

Credit: NASA/Johns Hopkins University Applied Physics Laboratory/Southwest Research Institute
Seen on The Planetary Society Blog.
See the description here.

Credit: NASA/Johns Hopkins University Applied Physics Laboratory/Southwest Research Institute
Seen on The Planetary Society Blog.
See the description here.
The dark matter ring

When you see this image in the popular media, be sure to realize it's a statistical map of the distribution of dark matter around a galaxy cluster _superimposed_ on an image of the cluster. It's not an image of dark matter. The actual image is this one:

By looking at the blue arcs in the image, astronomers can map how the massive galaxy cluster bends light from a more distant galaxy behind the cluster, and compare that distribution with what they see in the visible.
Here's a crop of the upper-left section of the cluster--you can see distorted images of a blue, star-forming, possibly spiral galaxy. The paper will probably have a reconstituted image of the lensed galaxy.
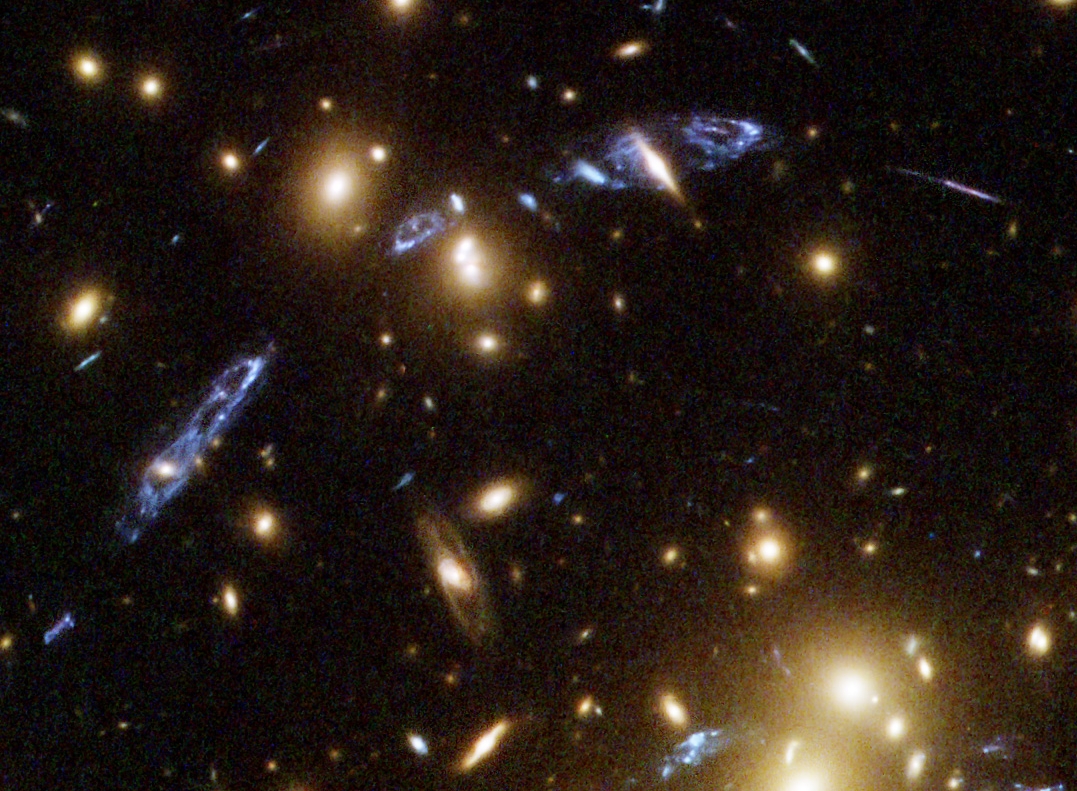
It's unfortunate that many people will see the blue image and think Hubble directly imaged some dark matter. The more important detail of the science was the ring shape and the proposed physics behind the shape from galaxy interactions.
More discussionn at Bad Astronomy
Saturday, May 12, 2007
Mmm.. carbonated beverage
I love this sort of linguistic research:

Can you argue for northeastern transplants to California, Arizona, and Miami setting the default as soda? What about St. Louis? Why is Nevada such a heterogeneous place? (My bet is lack of data). See the original project here: http://popvssoda.com:2998/
Can you argue for northeastern transplants to California, Arizona, and Miami setting the default as soda? What about St. Louis? Why is Nevada such a heterogeneous place? (My bet is lack of data). See the original project here: http://popvssoda.com:2998/
Tuesday, May 08, 2007
Two very lonely images
Two images that evoke loneliness, both from Mars. Both are from the Mars Rovers--one from Opportunity, one from Spirit.
Click on the images for the full-size versions.


Click on the images for the full-size versions.


Saturday, May 05, 2007
More HAT-2-b news
Systemic has the weather forecast for HAT-2-b: Hot and Stormy. Don't miss the movies 1 and 2
P.S. Well I suppose you could miss them. Unique patterns.
P.S. Well I suppose you could miss them. Unique patterns.
Friday, May 04, 2007
Wednesday, May 02, 2007
A new exoplanet from HAT
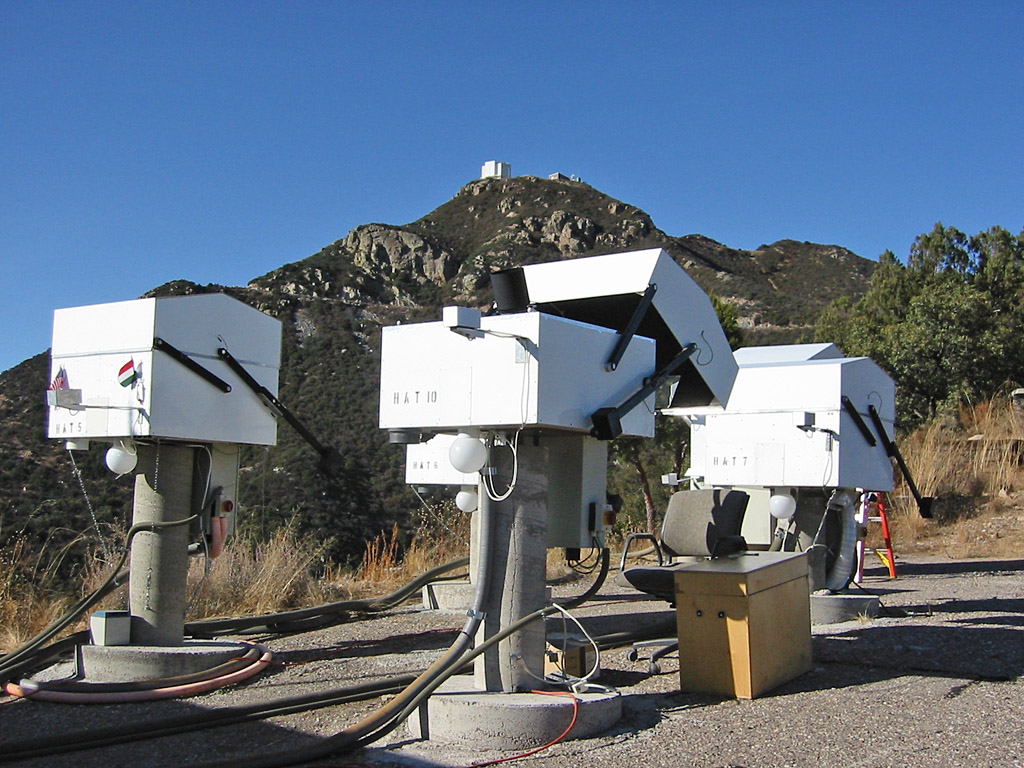
Last December four members of the RAS were lucky enough to spend four days at the MMT/Fred L. Whipple Observatory located on Mt. Hopkins south of Tucson talking to researchers and observers. One of the systems located at the "Ridge" area of the mountain was HAT, the "Hungarian-made Automated Telescope", a collection of small scopes there at Mt. Hopkins and in Hawaii. Gaspar was too busy working to talk to us, but we now know why. The collabration has discovered a huge exoplanet orbiting HD 147506, an eight-magnitude star 441 light-years away in the constellation Hercules. It's about an eight-Jupiter mass planet in an eccentric short 5.63 day orbit around a hot F8 star, and it's as dense as a terrestrial-style planet! It was discovered because from Earth, its orbit crosses the face of the star. The next transit is tomorrow morning (from here in North America).
http://adsabs.harvard.edu/abs/2001PADEU..11..107B
Monday, April 30, 2007
Mercury in compact fluorescents
Ah drat. A slashdot article appeared about some poor lady in Maine broke a compact fluorescent lamp and freaked out about the small amount of mercury in it. A questionable journalist wrote an article about the freakout.
I had a draft article about the issue: Compact fluorescents contain mercury. How does this amount compare to the amount of mercury released by using a standard incandescent lamp? So enjoy my sketchy calculations below.
Lamp Amount (mg.)
Pre 1988 T-12:~45
Post 1988 T-12: ~11.6
Typical T8: ~4 to 5
Low Mercury T8: ~3
CFL: ~4 to 5
Type Mercury content mg/unit*
Fluorescent lamp: 10
Straight fluorescent with diffusion barrier coating: 6
Compact fluorescent lamp: 4 - 23 W: 5
26 - 55 W: 10
Source: http://www.helcom.fi/Recommendations/en_GB/rec23_4/
26 watt CF: 8 hours a day, per year uses 75.92 kWh. At roughly 10 cents/kwh (new IL prices), $7.59 a year.
100 watt incandescent 8 hours a day, per year: 292 kWh. $29.20.
every 1000kWh produces 619lbs CO2 for ComEd power, which was 27% coal. (12 months prior to march 2004) Excelon environmental release
(Although recently it's been very highly nuclear, up to 92% in fall 2006).
2/3 of mercury in coal escapes to air http://www.epa.gov/mercury/control_emissions/index.htm
0.17ppm average Hg content in US Coal http://igs.indiana.edu/Geology/coalOilGas/mercuryInCoal/index.cfm
Indiana coal varied from 0.31ppm to 0.02ppm
# The thermal energy content of coal is 6,150 kWh/ton. Even though coal-fired power generators are very efficient, only about 40% of the thermal energy in coal converts to electricity. So the electricity generated per ton of coal is (0.4 ton)(6,150 kWh) = 2,460 kWh/ton.
(ISA: Maximize energy buck with efficient bang)
For our 100W incandescent, it burns 292kWh per year, of which 27% is coal, which means 64lbs (29kg) of coal is burned in IL. 0.17ppm of that is 4.93mg Hg, which 66% escapes: 3.29mg Hg.
Our compact fluorescent will produce 26% of that much mercury, or 0.86mg Hg. At 8000 hours lifetime, that's roughly just short of three years of 8hrs/day. So we'd release 2.37mg of Hg for the lifetime of the bulb, while the incandescent would release 9mg over that same time period. Add the existing 4 to 5mg per CFL, and the CF still is releasing less mercury into the environment.
This calculation gets worse and worse the more coal your power is made from. Illinois has the highest production of nuclear power of any state, so using compact fluorescents reduce the release of mercury into the environment, if you ignore renewables like hydroelectric. The nation as a whole uses 50% coal as its power source.
I had a draft article about the issue: Compact fluorescents contain mercury. How does this amount compare to the amount of mercury released by using a standard incandescent lamp? So enjoy my sketchy calculations below.
Lamp Amount (mg.)
Pre 1988 T-12:~45
Post 1988 T-12: ~11.6
Typical T8: ~4 to 5
Low Mercury T8: ~3
CFL: ~4 to 5
Type Mercury content mg/unit*
Fluorescent lamp: 10
Straight fluorescent with diffusion barrier coating: 6
Compact fluorescent lamp: 4 - 23 W: 5
26 - 55 W: 10
Source: http://www.helcom.fi/Recommendations/en_GB/rec23_4/
26 watt CF: 8 hours a day, per year uses 75.92 kWh. At roughly 10 cents/kwh (new IL prices), $7.59 a year.
100 watt incandescent 8 hours a day, per year: 292 kWh. $29.20.
every 1000kWh produces 619lbs CO2 for ComEd power, which was 27% coal. (12 months prior to march 2004) Excelon environmental release
(Although recently it's been very highly nuclear, up to 92% in fall 2006).
2/3 of mercury in coal escapes to air http://www.epa.gov/mercury/control_emissions/index.htm
0.17ppm average Hg content in US Coal http://igs.indiana.edu/Geology/coalOilGas/mercuryInCoal/index.cfm
Indiana coal varied from 0.31ppm to 0.02ppm
# The thermal energy content of coal is 6,150 kWh/ton. Even though coal-fired power generators are very efficient, only about 40% of the thermal energy in coal converts to electricity. So the electricity generated per ton of coal is (0.4 ton)(6,150 kWh) = 2,460 kWh/ton.
(ISA: Maximize energy buck with efficient bang)
For our 100W incandescent, it burns 292kWh per year, of which 27% is coal, which means 64lbs (29kg) of coal is burned in IL. 0.17ppm of that is 4.93mg Hg, which 66% escapes: 3.29mg Hg.
Our compact fluorescent will produce 26% of that much mercury, or 0.86mg Hg. At 8000 hours lifetime, that's roughly just short of three years of 8hrs/day. So we'd release 2.37mg of Hg for the lifetime of the bulb, while the incandescent would release 9mg over that same time period. Add the existing 4 to 5mg per CFL, and the CF still is releasing less mercury into the environment.
This calculation gets worse and worse the more coal your power is made from. Illinois has the highest production of nuclear power of any state, so using compact fluorescents reduce the release of mercury into the environment, if you ignore renewables like hydroelectric. The nation as a whole uses 50% coal as its power source.
Friday, April 27, 2007
Hayabusa data release
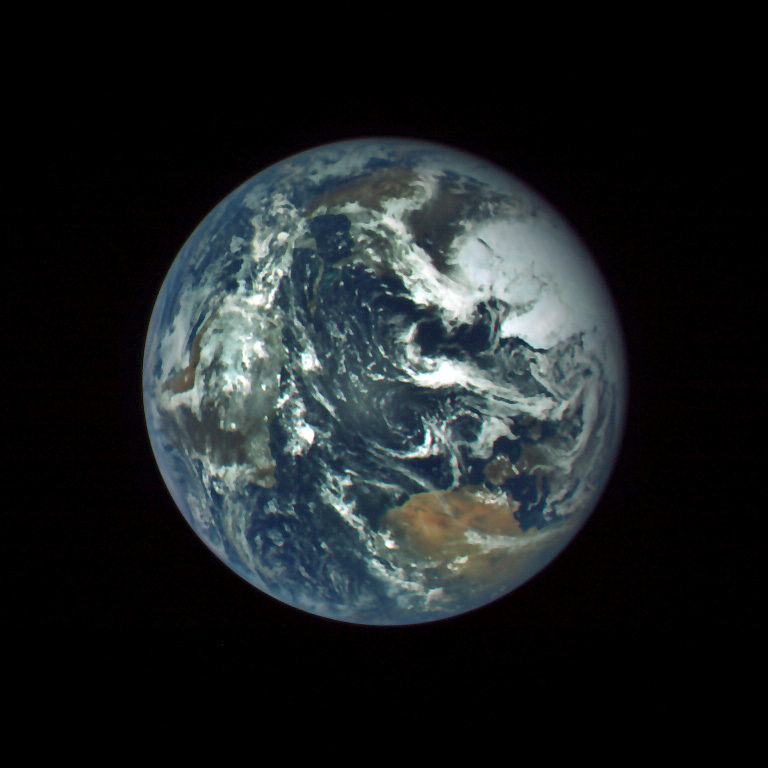
The ambitious Japanese asteroid project, Hayabusa, has released its data archive. The asteroid Itokawa was the target; whether they successfully picked up any of it might be known if the spacecraft returns to Earth successfully in 2010.
The imager on the spacecraft was AMICA, and the data archive is available here. A sample image would be this one, showing Itokawa truly is a rubble pile.

I took three filtered images taken during an Earth flyby and made the image above from them. I'll play with some of the Itowaka images as well and see what comes out of them.
Thursday, April 26, 2007
Yerkes Observatory trip
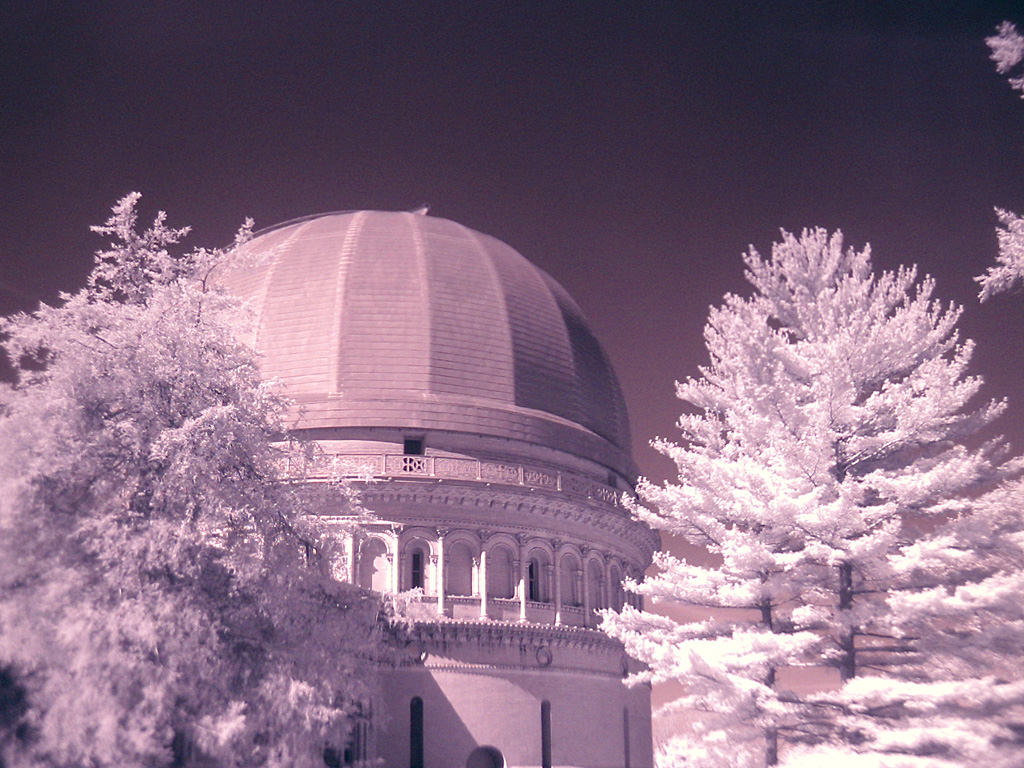
The Ryerson Astronomical Society sponsored a trip up to Yerkes Observatory this weekend. We split the 60-odd visitors into three groups and showed them the observatory through twilight. I got to show them the basement and the 24-inch reflector--fairly mundane things, and there is only so much you can opine about the difference between astronomy and astrophysics three times in a row. So, while talking about the infrared camera called HAWC on the second-generation flying telescope called SOFIA, scheduled for its first test flight today!, I tried my best to talk about light outside of our visible range. And I had to bring up near-infrared radiation and took some examples with each group. The above image is from the next morning. Everyone hopefully had fun looking through all the scopes, including the world's largest refractor, at various targets. Halfway through the observing I moved the 24-inch onto Messier 51, the spectacularly interacting galaxy pair in Canes Venatici, just off the handle of the Big Dipper. I would say some two-thirds or more of the visitors saw the spiral arms. After the big group left, the overnighters returned to the 24-inch at as M51 was transitting, the arms were much more evident.

(An example from Ryerson Observatory of M51).
Tuesday, April 24, 2007
terrestrial exoplanet
The Bad Astronomer is reporting the ESO has discovered a terrestrially-sized exoplanet. It seems the ESO hasn't released the embargo on the info yet.
P.S. Systemic talks about it.
P.P.S. The Press Release.
P.S. Systemic talks about it.
P.P.S. The Press Release.
Biodiesel vs. petroleum: greenhouse gas emissions and N2O
A press release recently reported research that claims biodiesel will cause more greenhouse gas effect than using petroleum oil. The gist is that agriculture with industrial fertilizers release some N2O unintentionally as part of nitrogen fertilization, and that nitrous oxide has a much stronger effect on global warming because it has a long lifetime in the atmosphere. The UN defines a "Global Warming Potential" for each greenhouse gas. Lifetime in the atmosphere is the primary factor (perhaps the only factor?), so nonreactive gases like CFCs, which live nearly forever, have incredible numbers (50000) for their "effect". CO2, though, is just defined as 1, even though it has a variable lifetime in the atmosphere of 5-200 years (page 38). I don't know if the spectral absorption of each gas was taken into effect for these--I see no information that it is. N2O lives for about 120 years in the atmosphere, a fairly nonreactive gas, and it is this multiplication factor, (296x), that drives the conclusion about how biodiesel via rapeseed is worse than petroleum in greenhouse gas emissions.
I would have liked to read the actual paper via my institutional subscription, but it's not available yet online or in paper.
The linked press release is actually from a tropical conservation group, and interestingly they happened to add a graph with yields of biodiesel per acre, showing rapeseed as middle of the pack in terms of yield. What would happen to the analysis with other crops? What if we didn't use so much nitrogen fertilizer or didn't exclusively produce rapeseed? (You can nitrogenate with legumes to avoid using some fertilizer). Was the absorption of CO2 from the atmosphere into the plant matter taken into consideration during the analysis? Questions I have, answers I can't find.
You might know rapeseed by another name: a special variety breed called canola (CANadian Oil Low Acid), which has much lower amounts of a naturally occurring toxic acid in it.
I would have liked to read the actual paper via my institutional subscription, but it's not available yet online or in paper.
The linked press release is actually from a tropical conservation group, and interestingly they happened to add a graph with yields of biodiesel per acre, showing rapeseed as middle of the pack in terms of yield. What would happen to the analysis with other crops? What if we didn't use so much nitrogen fertilizer or didn't exclusively produce rapeseed? (You can nitrogenate with legumes to avoid using some fertilizer). Was the absorption of CO2 from the atmosphere into the plant matter taken into consideration during the analysis? Questions I have, answers I can't find.
You might know rapeseed by another name: a special variety breed called canola (CANadian Oil Low Acid), which has much lower amounts of a naturally occurring toxic acid in it.
Subscribe to:
Posts (Atom)